Humanizing Data
data visualization • experience design • guided self-study
Overview
Humanizing data is a compilation of ongoing personal projects to experiment and play with data visualization, very much inspired by Giorgia Lupi's work and her Dear Data project with Stefanie Posavec. The main goal of these projects is to experiment with different ways to portray data in a more humanized and empathetic way to give a breadth of life to seemingly mundane things. These projects have also given me opportunities to focus on relevant topics or challenges that we face in our generation.
Project 2: Fashion & Sustainability (Fall 2020)
Project 1: Surroundings & Productivity (Spring 2020)
Overview
Humanizing data is a compilation of on-going personal projects to experiment and play with data visualization, very much inspired by Giorgia Lupi's work and her Dear Data project with Stefanie Posavec. The main goal of these projects is to experiment with different ways to portray data in a more humanized and empathetic way to give a breadth of life to seemingly mundane things. These projects have also given me opportunities to focus on relevant topics or challenges that we face in our generation.
Project 2: Fashion & Sustainability (Fall 2020)
Project 1: Surroundings & Productivity (Spring 2020)
Project 2: Fashion & Self-Reflection
Fall 2020. Personal Reflection and Exploration in Humanistic Approach of Data Viz.
Data = Reflection of Our Daily Lives
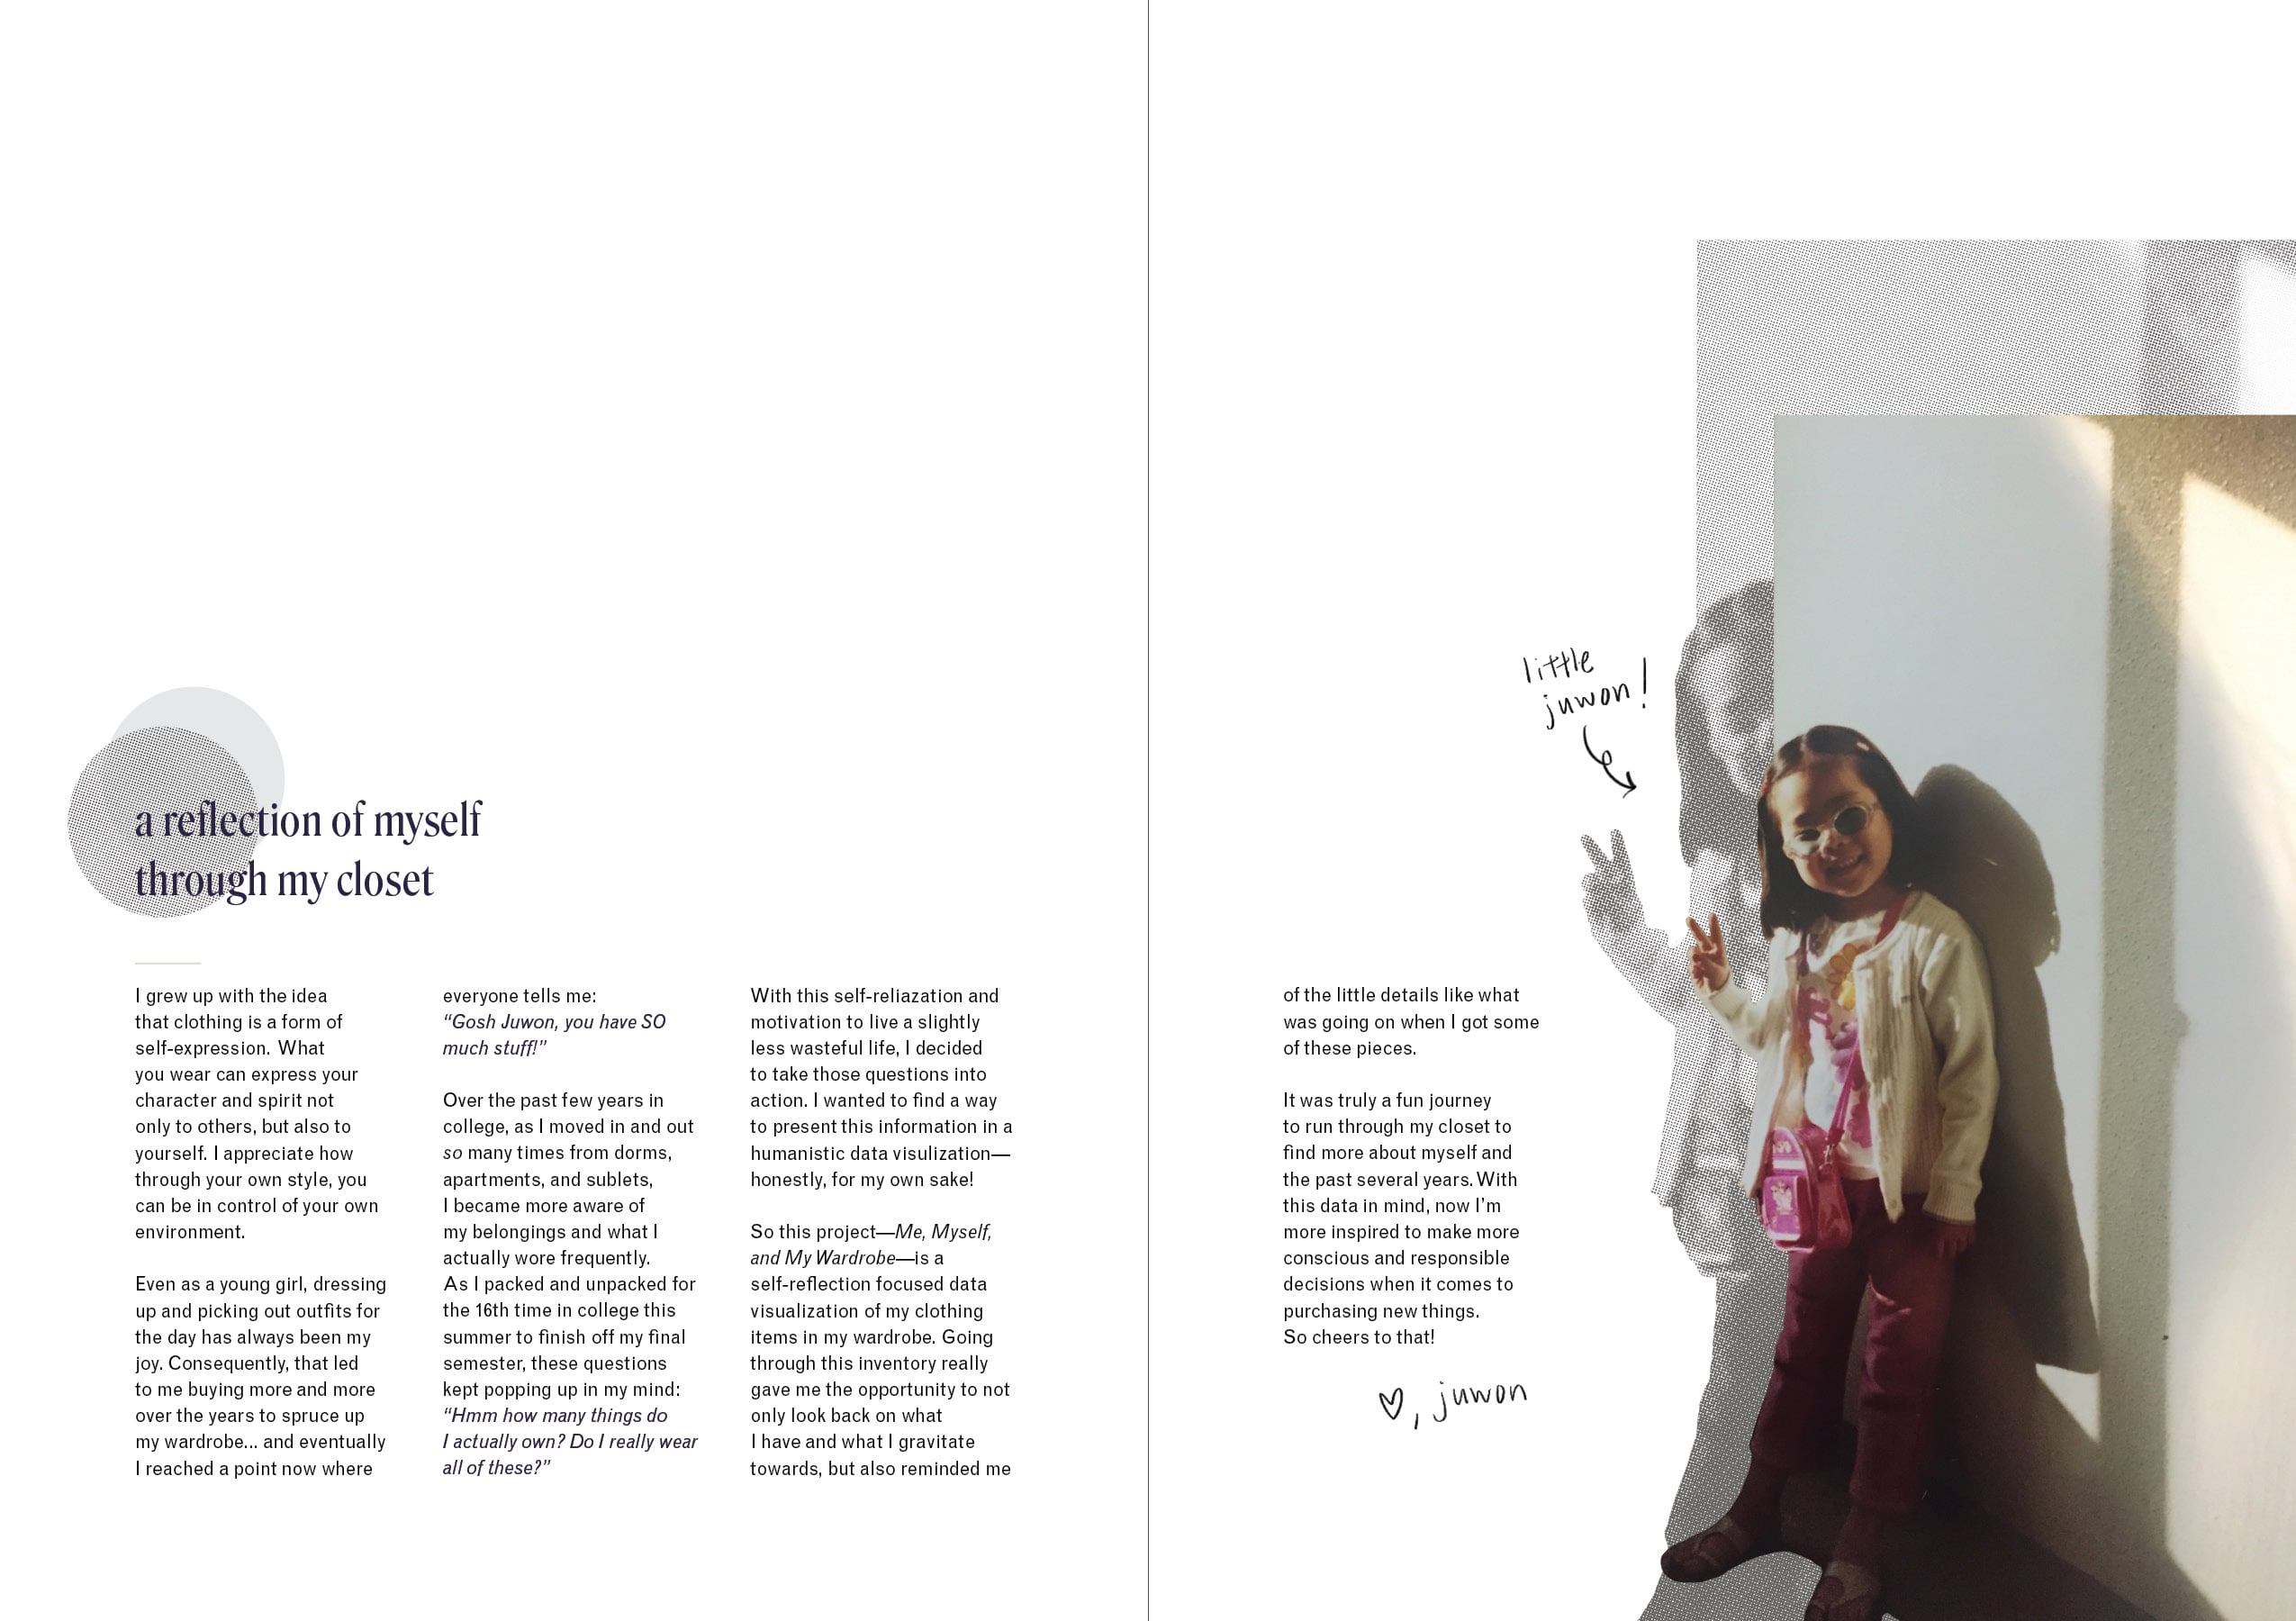
I'm passionate about the idea that data can be used to describe the details of our daily lives. I started to think about what I could quantify in my life to tell a story about myself or my tendencies. And one thing came to my mind... my clothings.
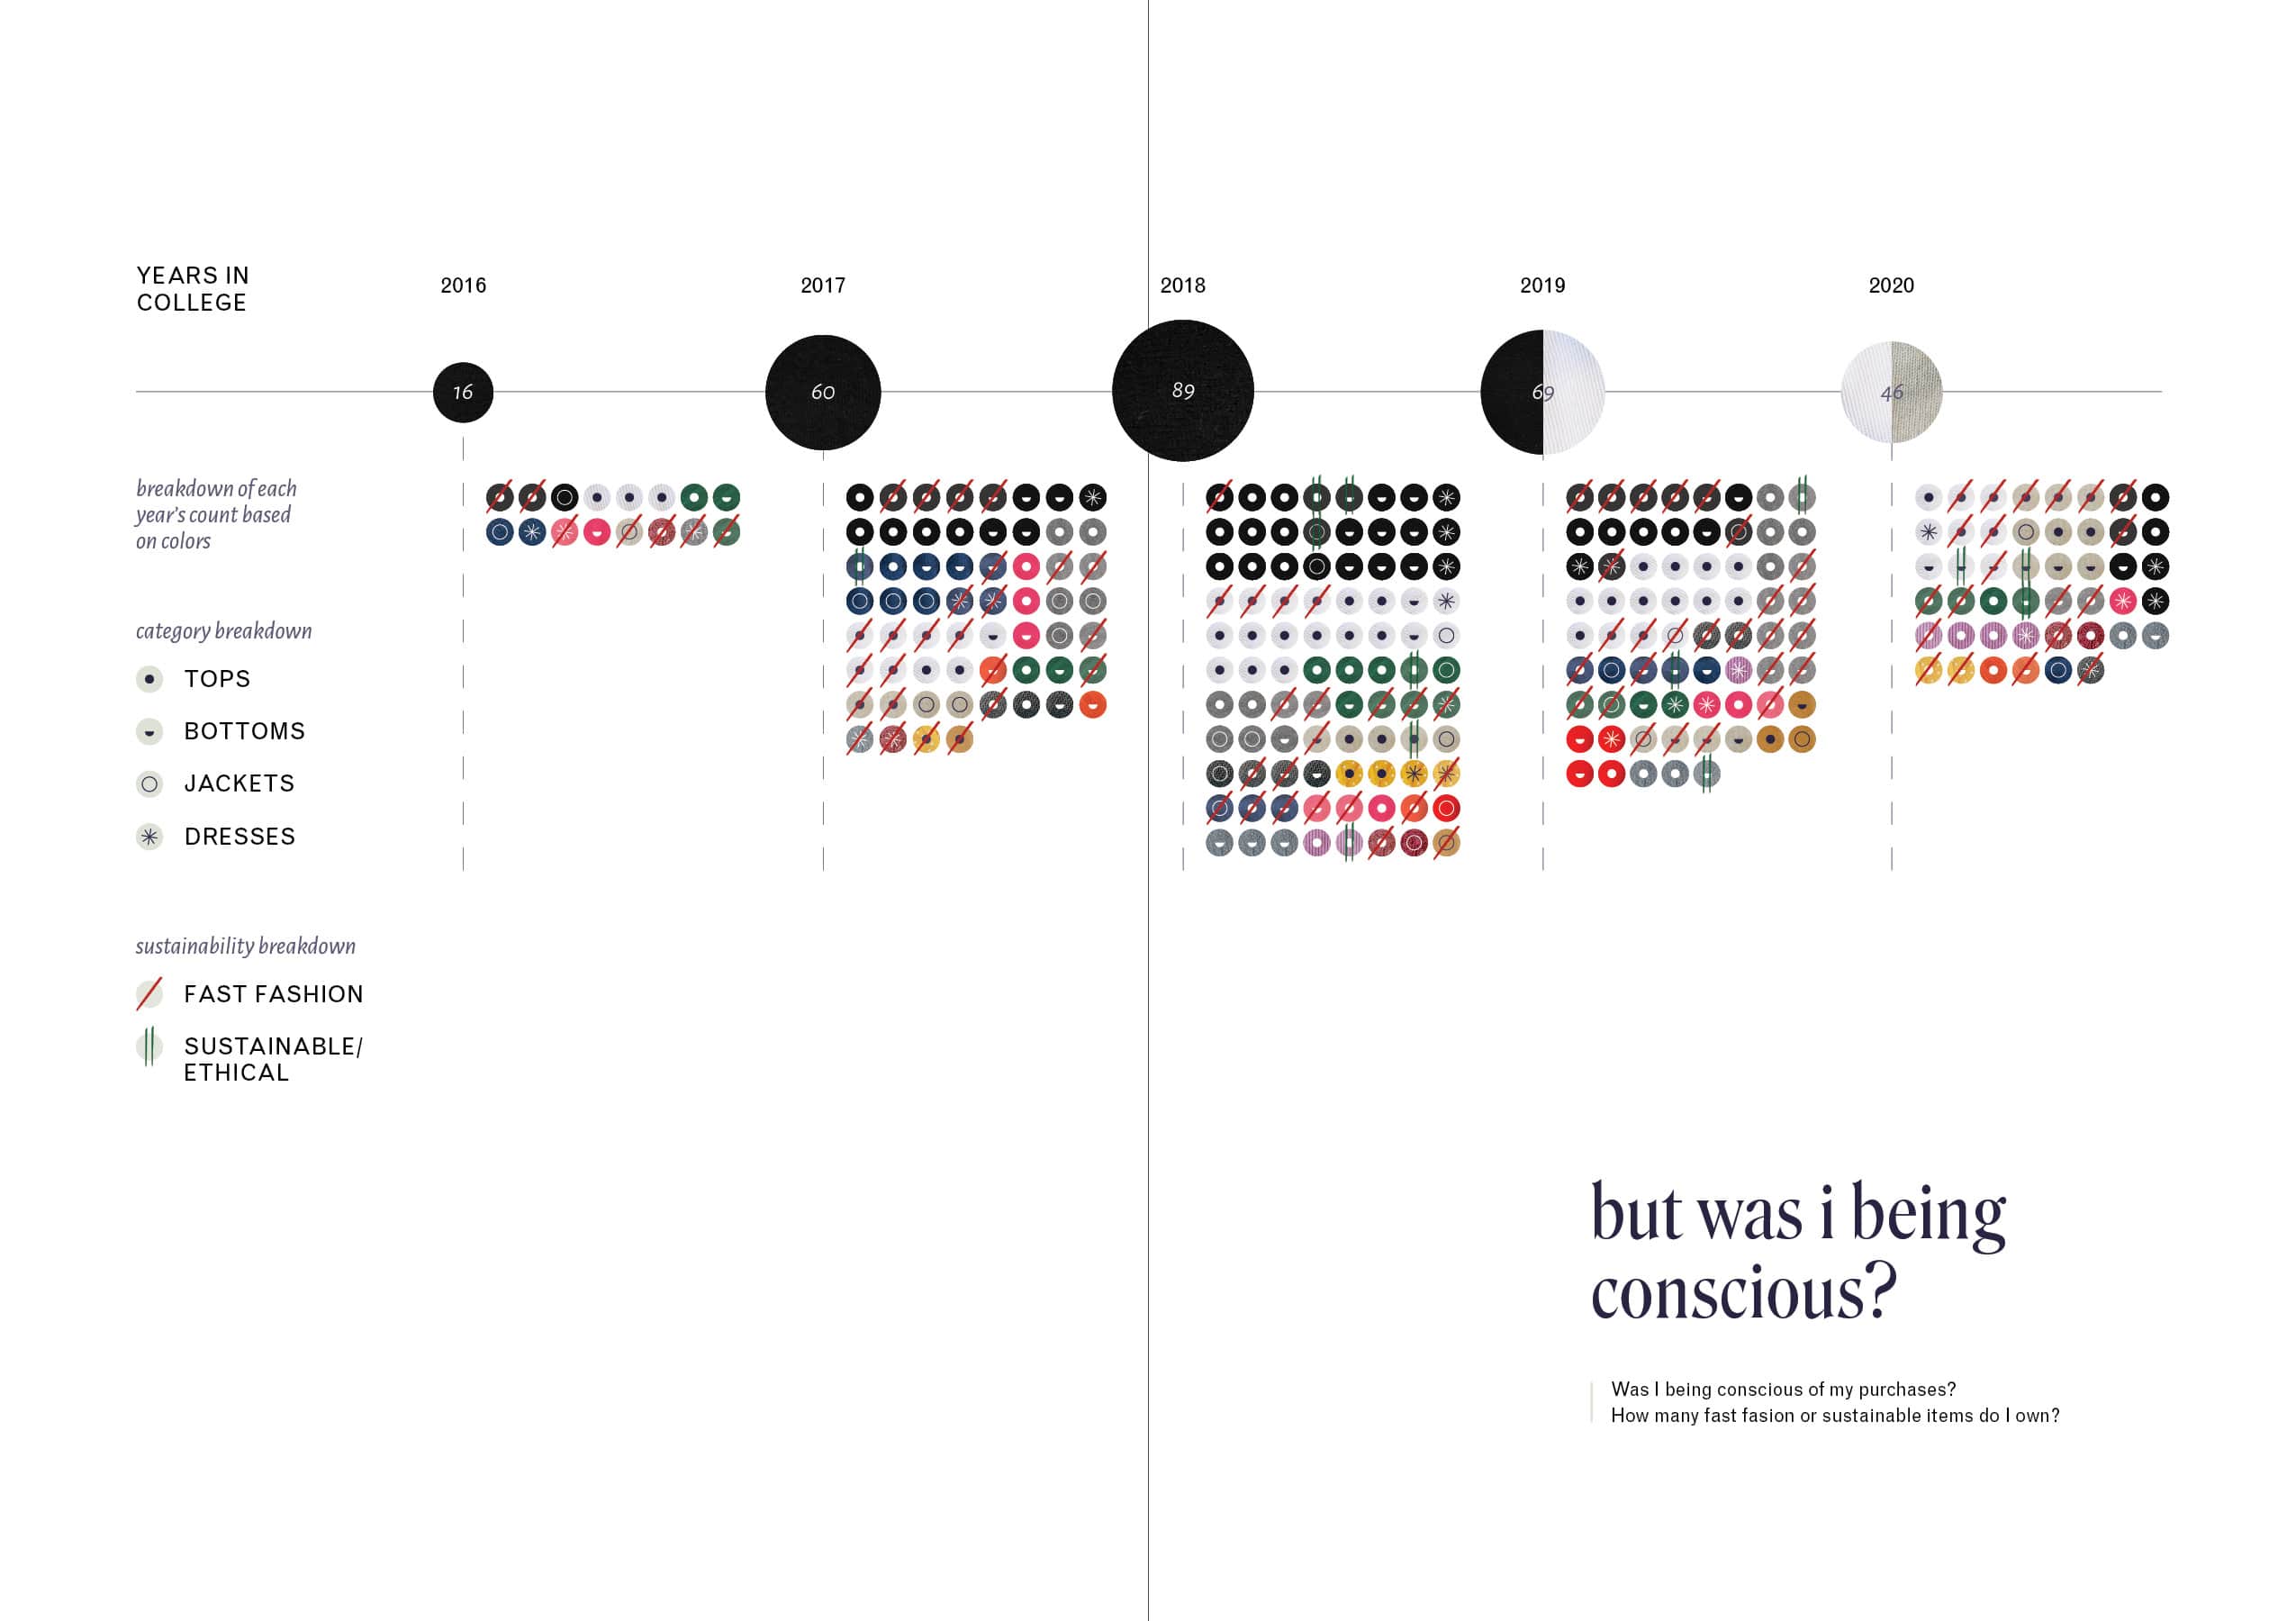
I've been a "maximalist" my entire life when it comes to fashion. Frankly, I haven't been the best at paying attention to sustainability and ethical issues in the industry as well. But through my many, many move-ins and outs in college, I started to pay more attention to my belongings and the connection I have with each of my pieces. I found it interesting that I could tie certain pieces of my wardrobe with specifics events that happened in my life. Also by paying attention to the brand and materials, I could see how sustainble/ethical my clothing choices have been.
Data = Reflection of Our Daily Lives
I'm passionate about the idea that data can be used to describe the details of our daily lives. I started to think about what I could quantify in my life to tell a story about myself or my tendencies. And one thing came to my mind... my clothings.
I've been a "maximalist" my entire life when it comes to fashion. Frankly, I haven't been the best at paying attention to sustainability and ethical issues in the industry as well. But through my many, many move-ins and outs in college, I started to pay more attention to my belongings and the connection I have with each of my pieces. I found it interesting that I could tie certain pieces of my wardrobe with specifics events that happened in my life. Also by paying attention to the brand and materials, I could see how sustainble/ethical my clothing choices have been.
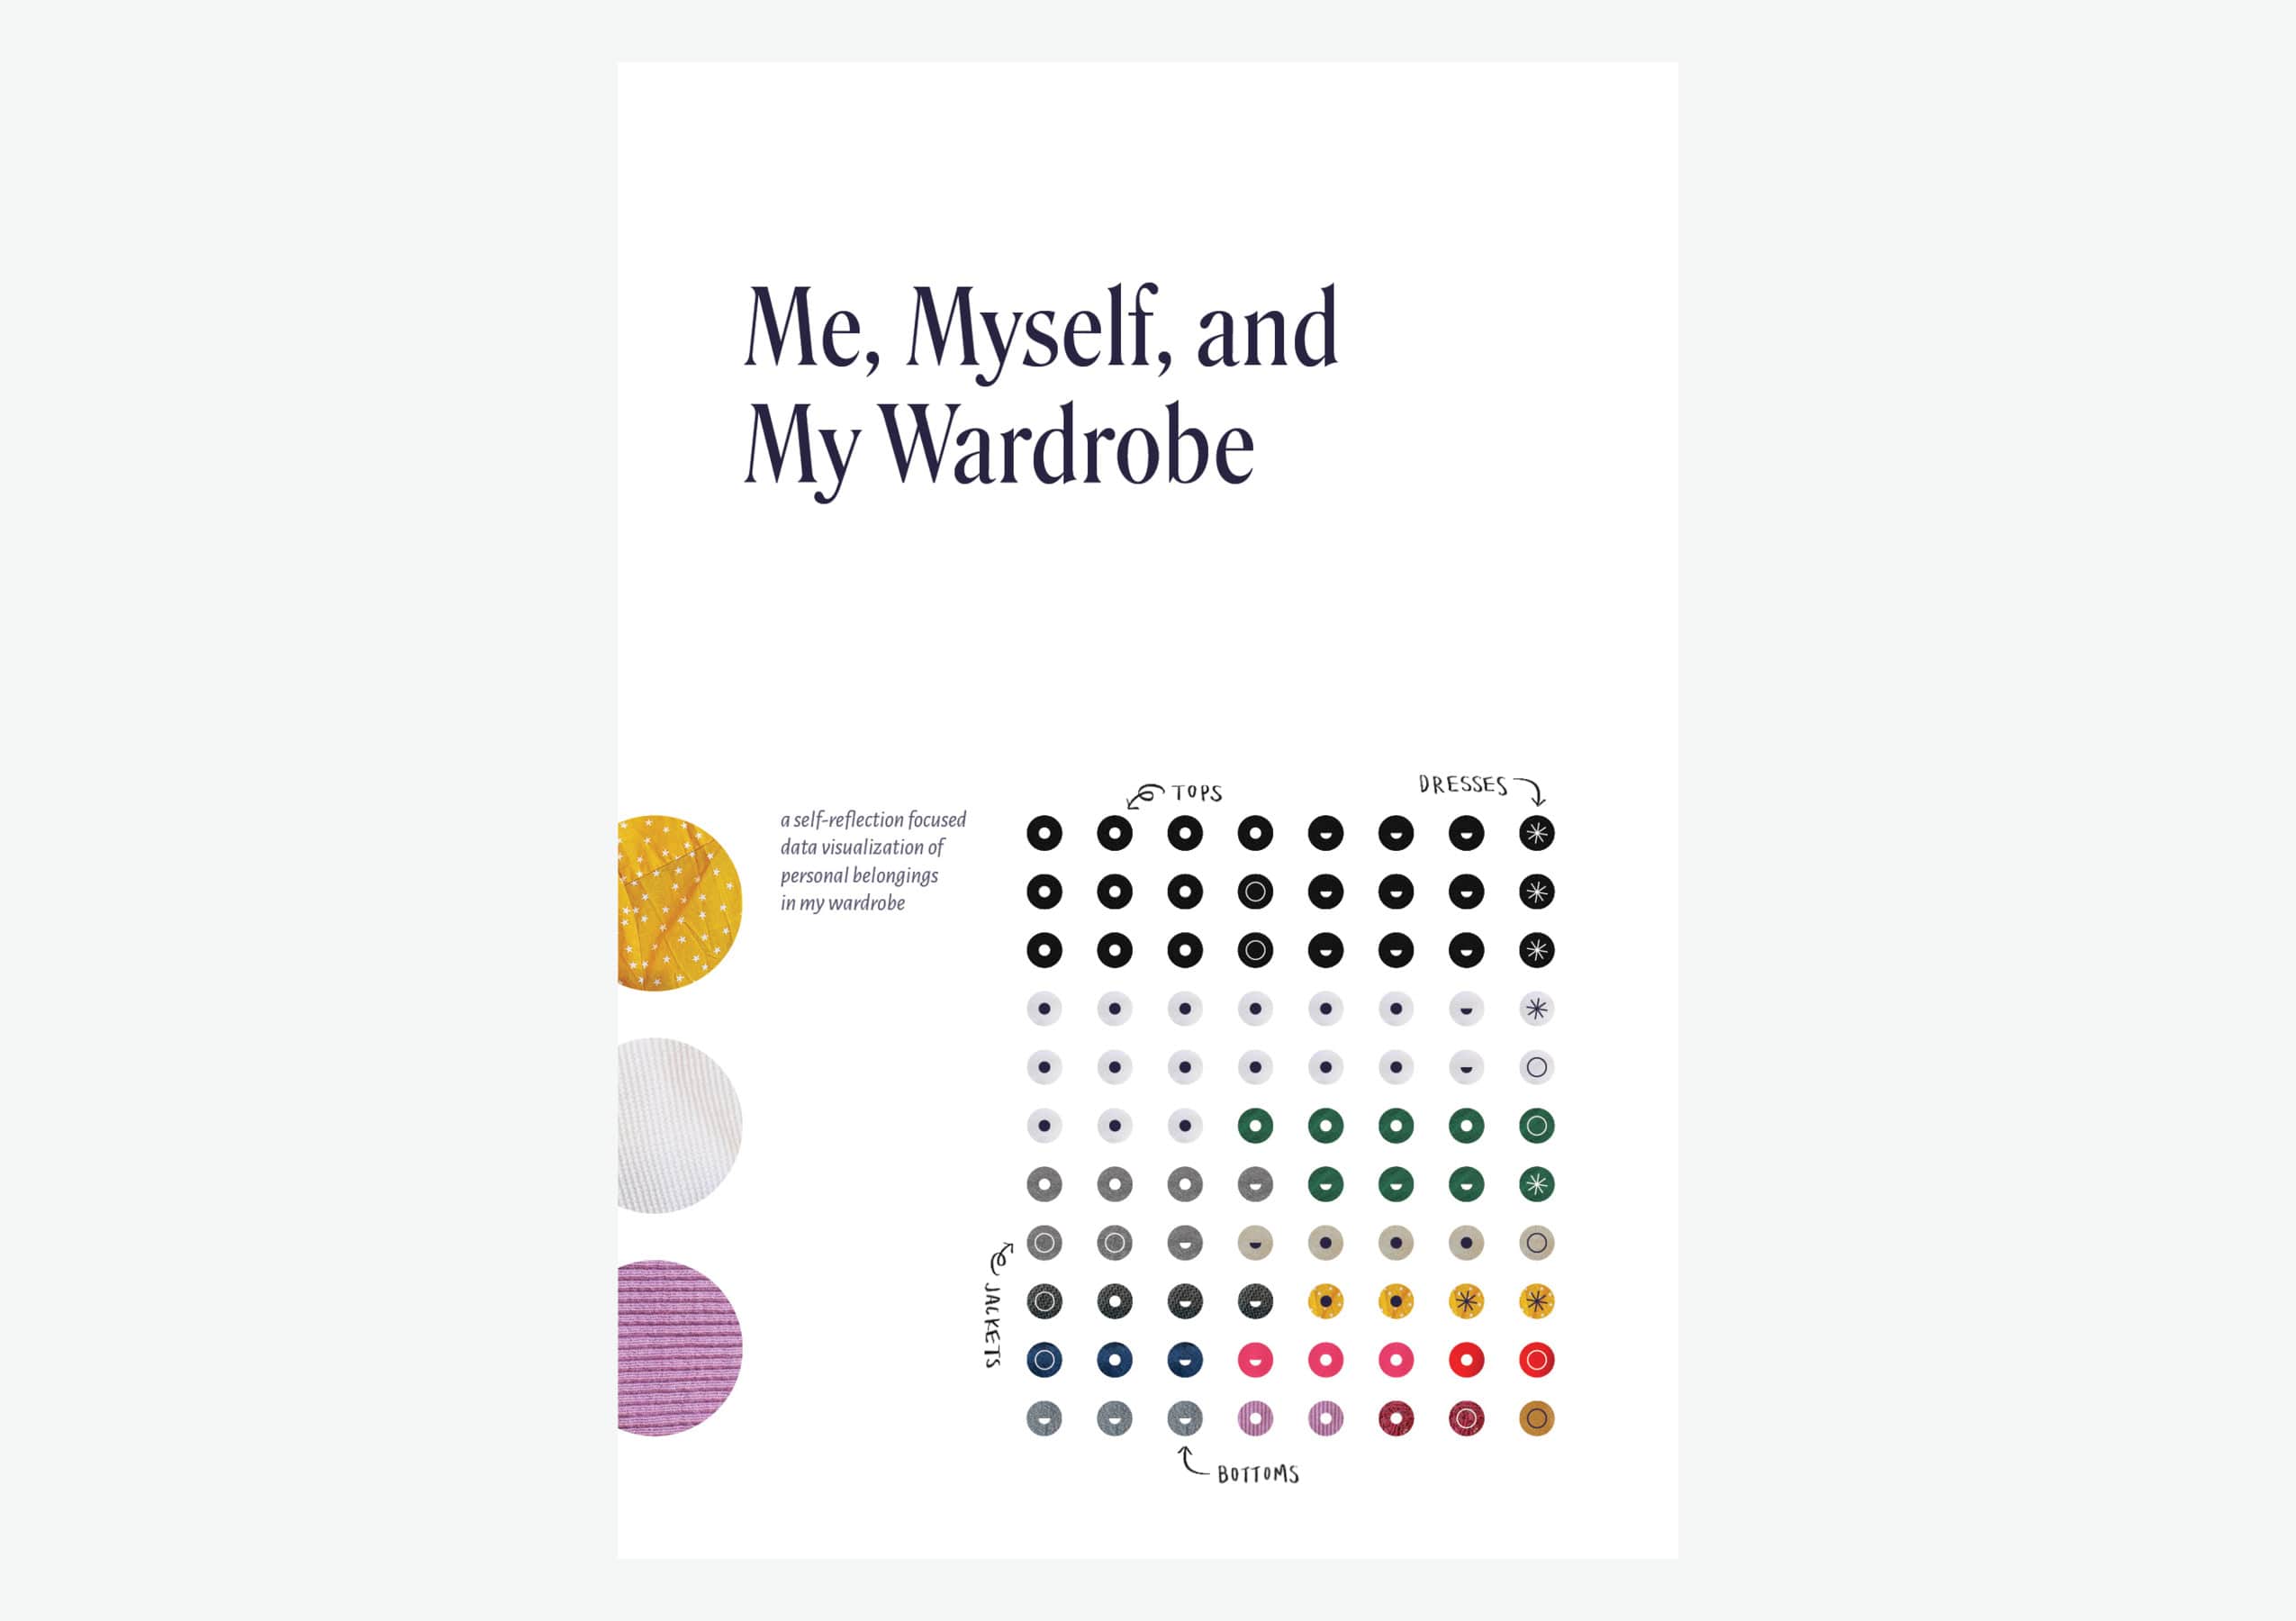
Self-Reflection Focused Data Visualization
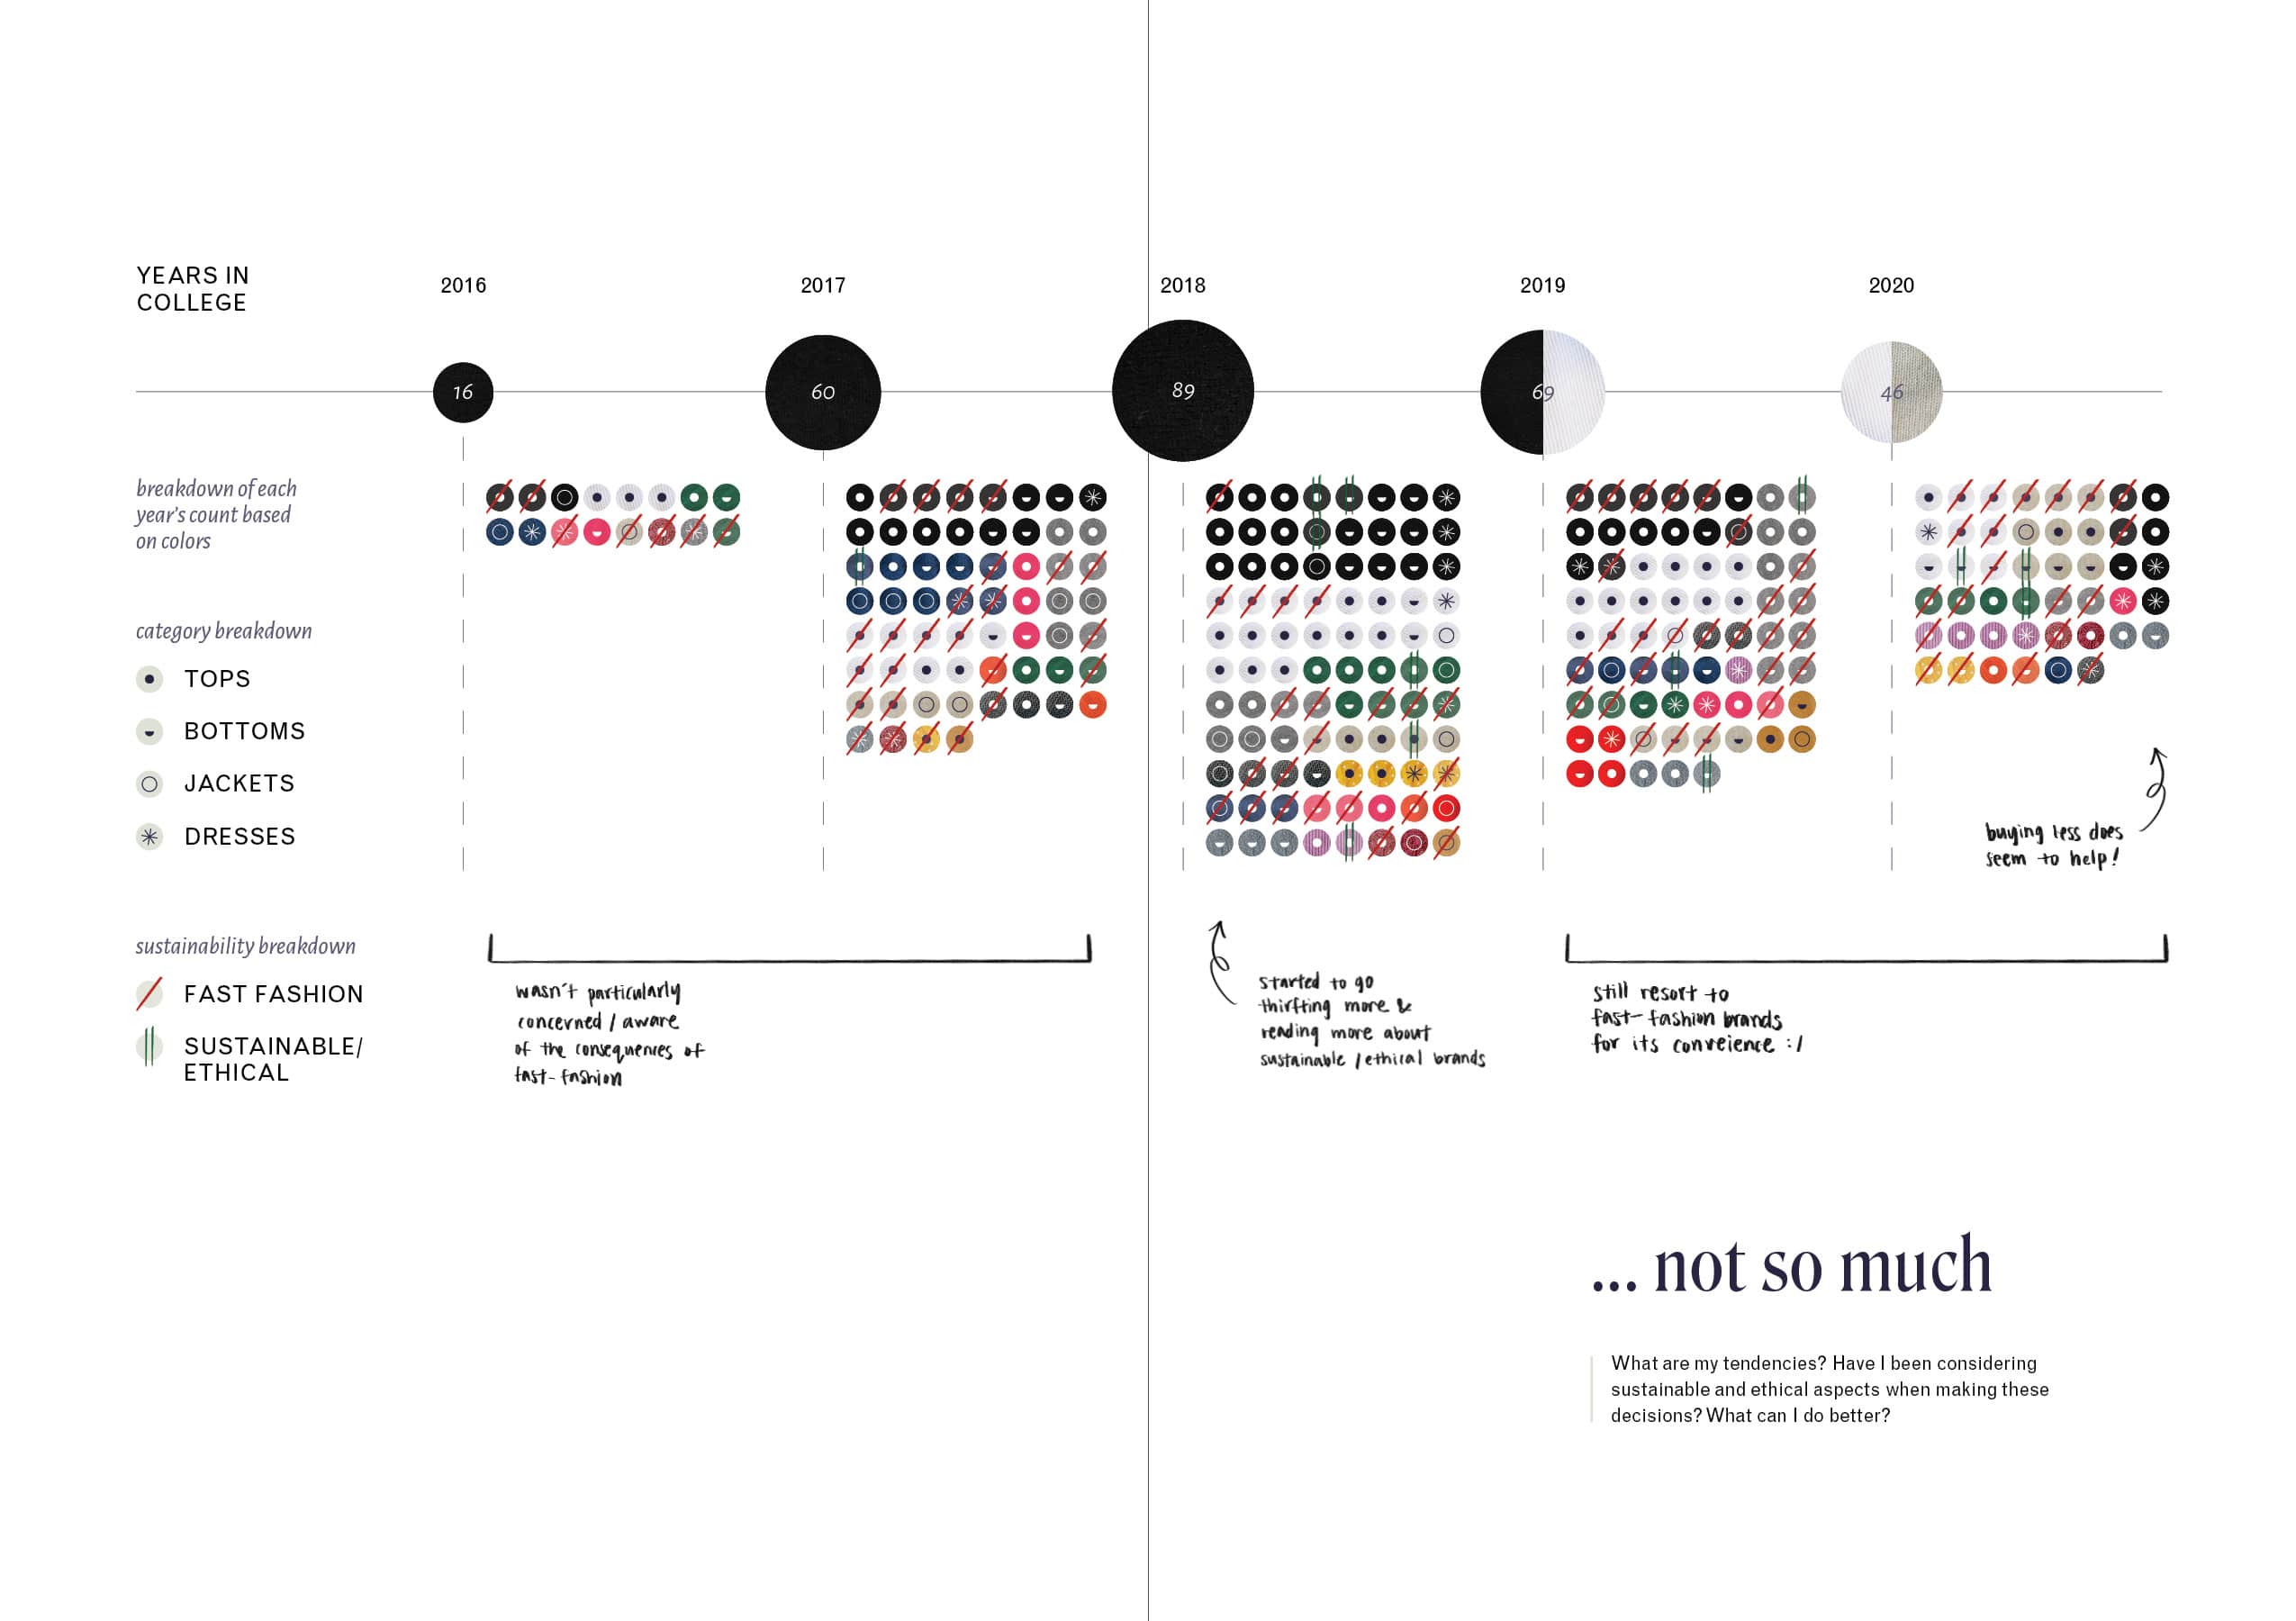
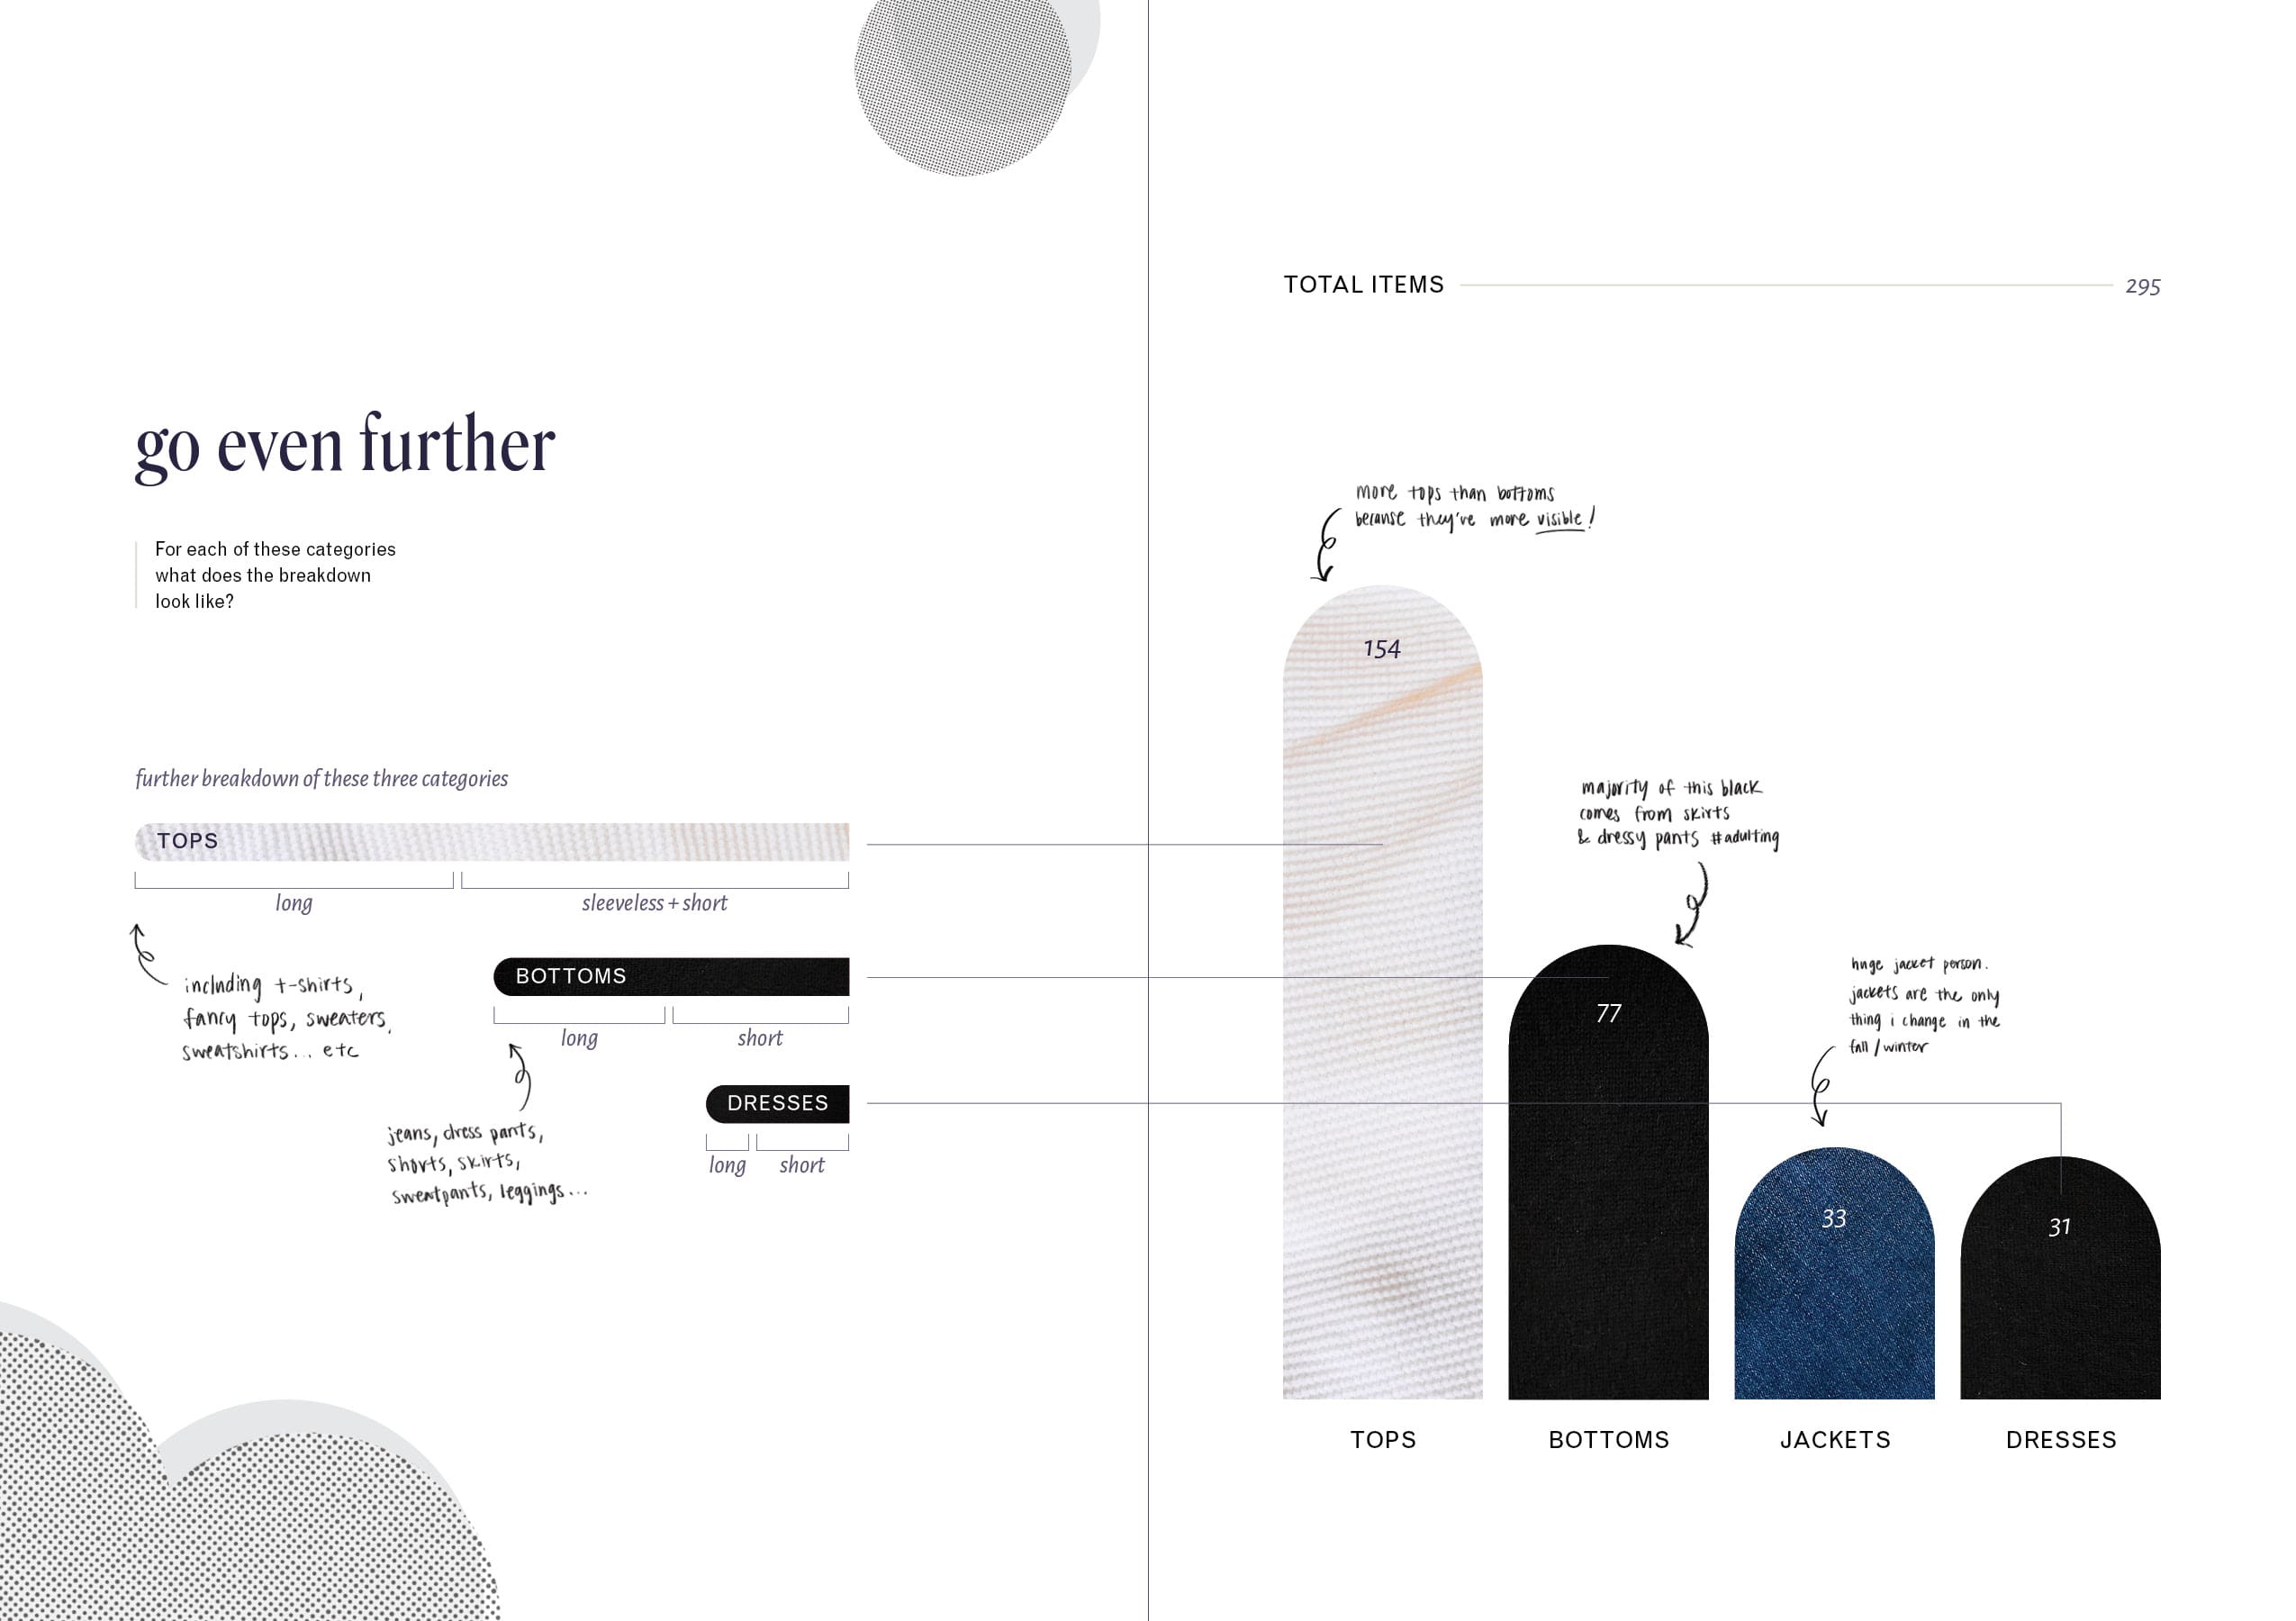
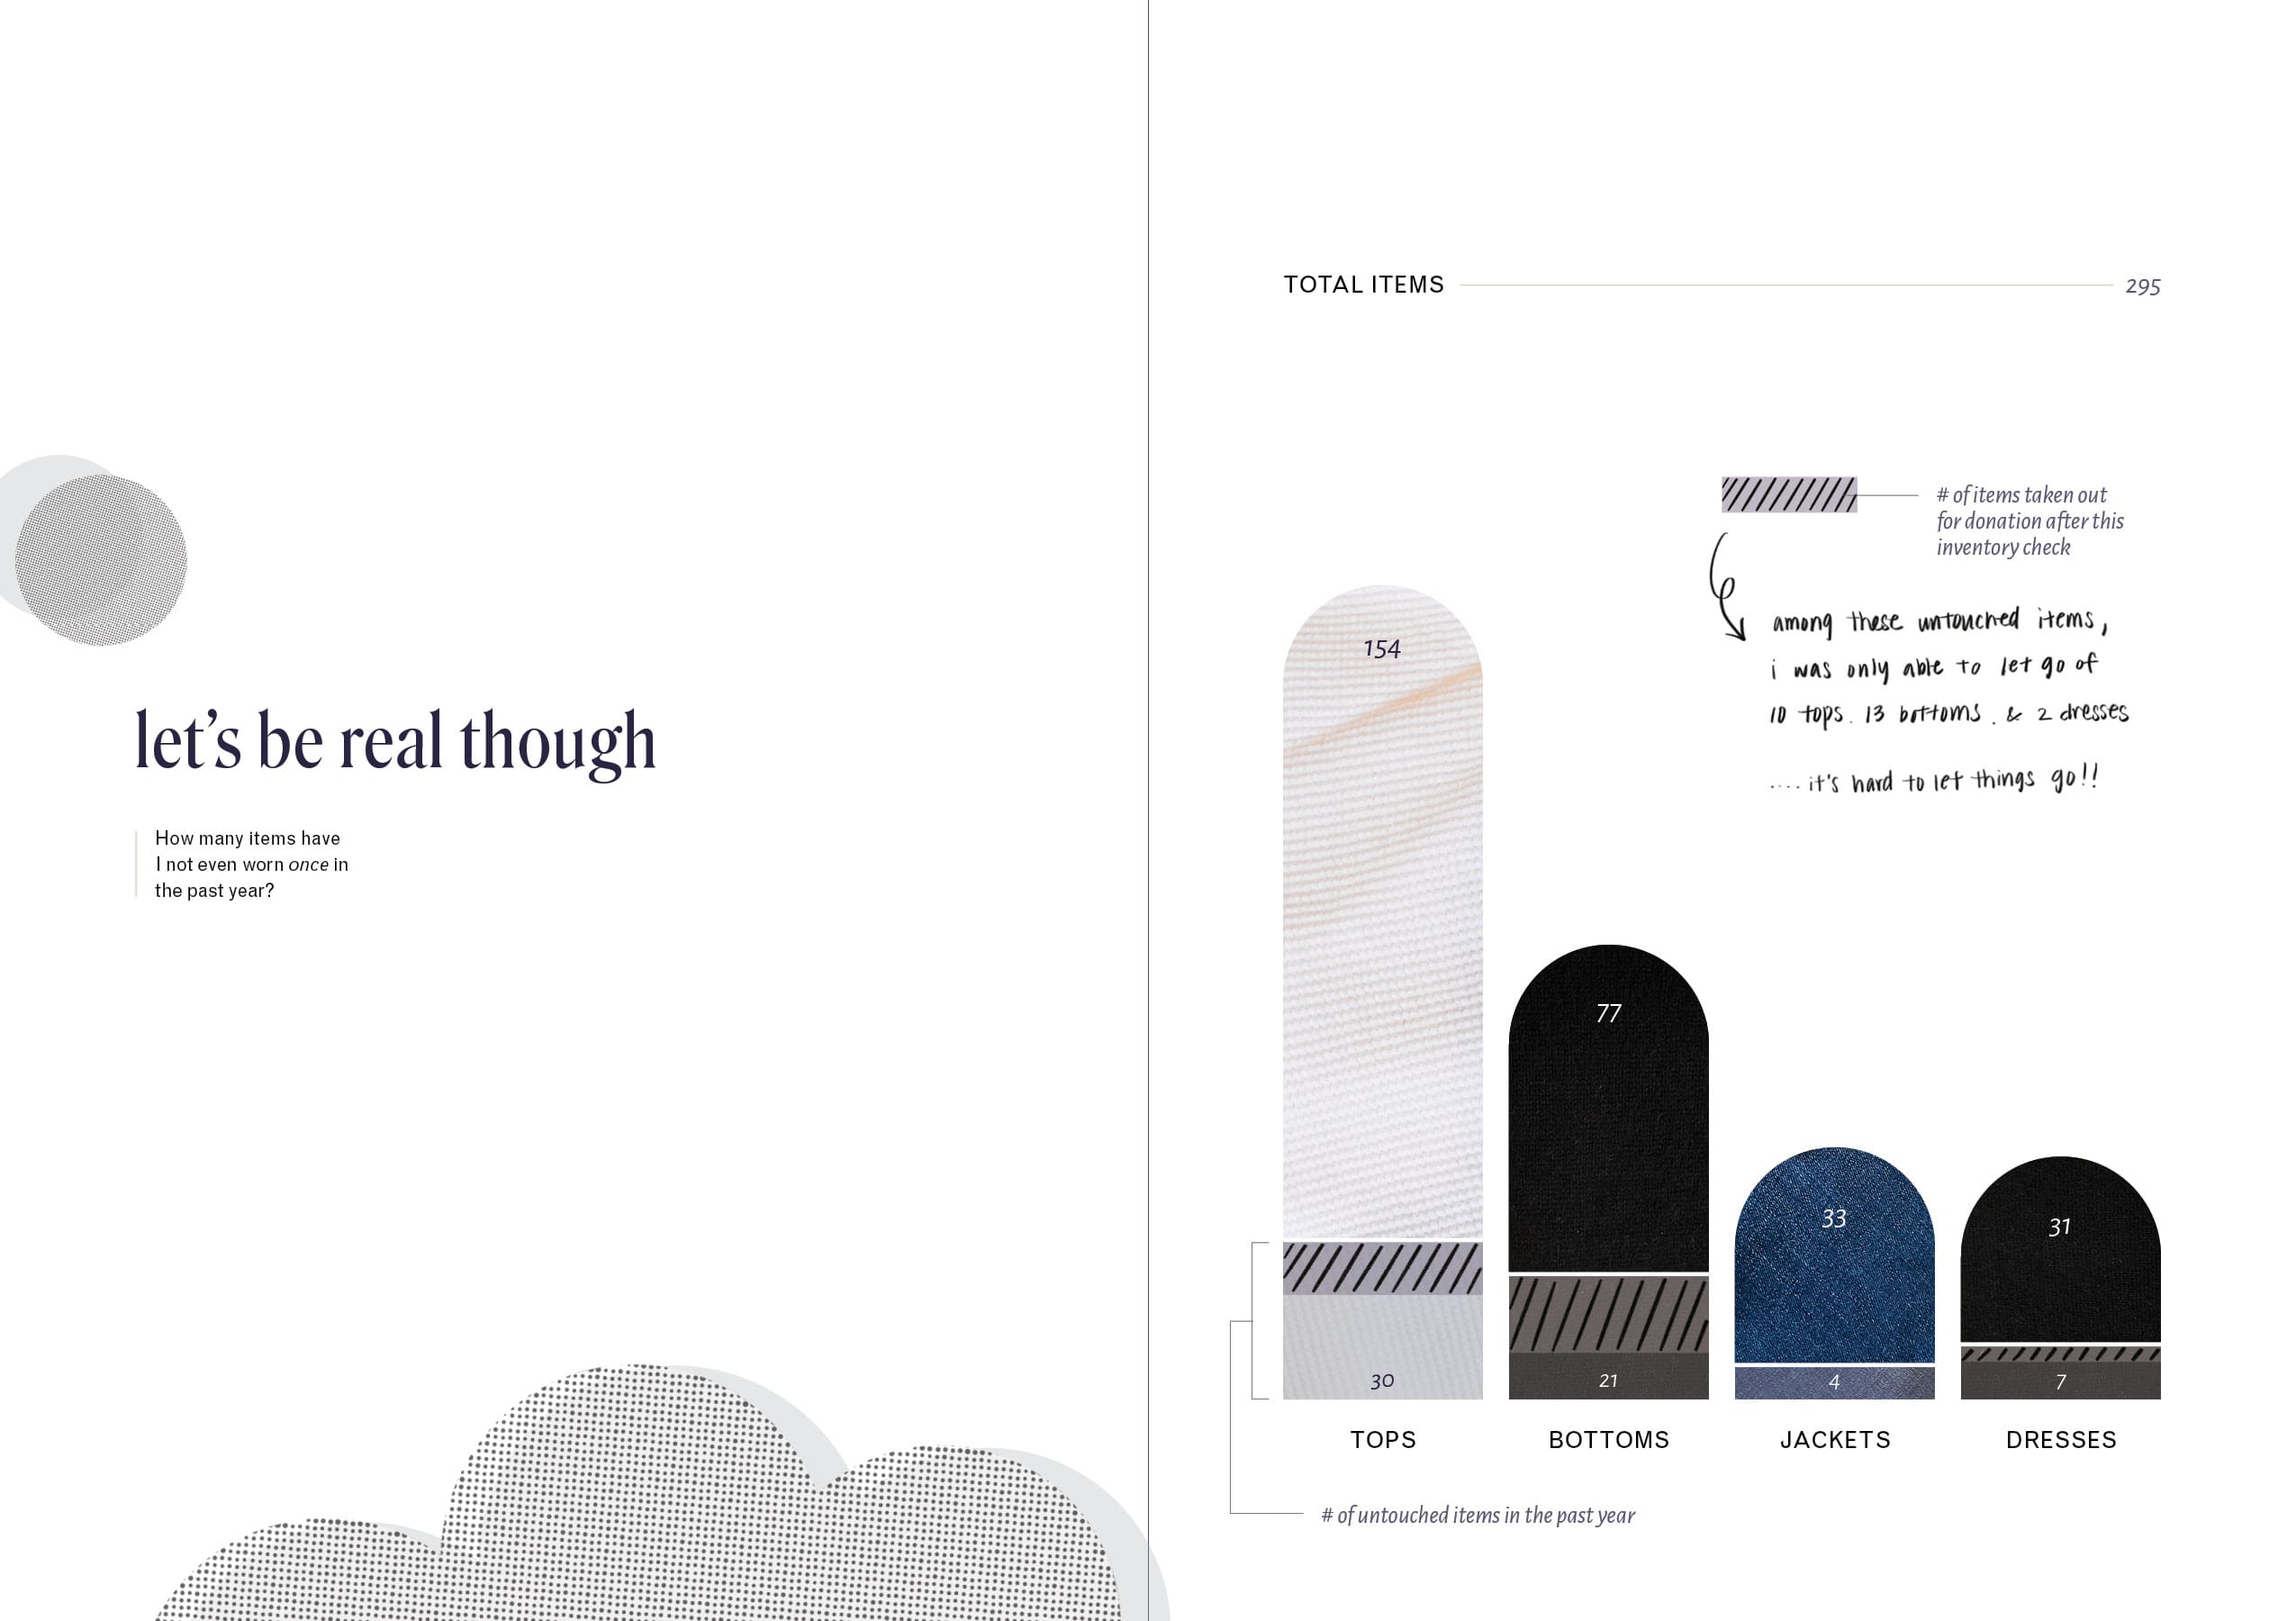
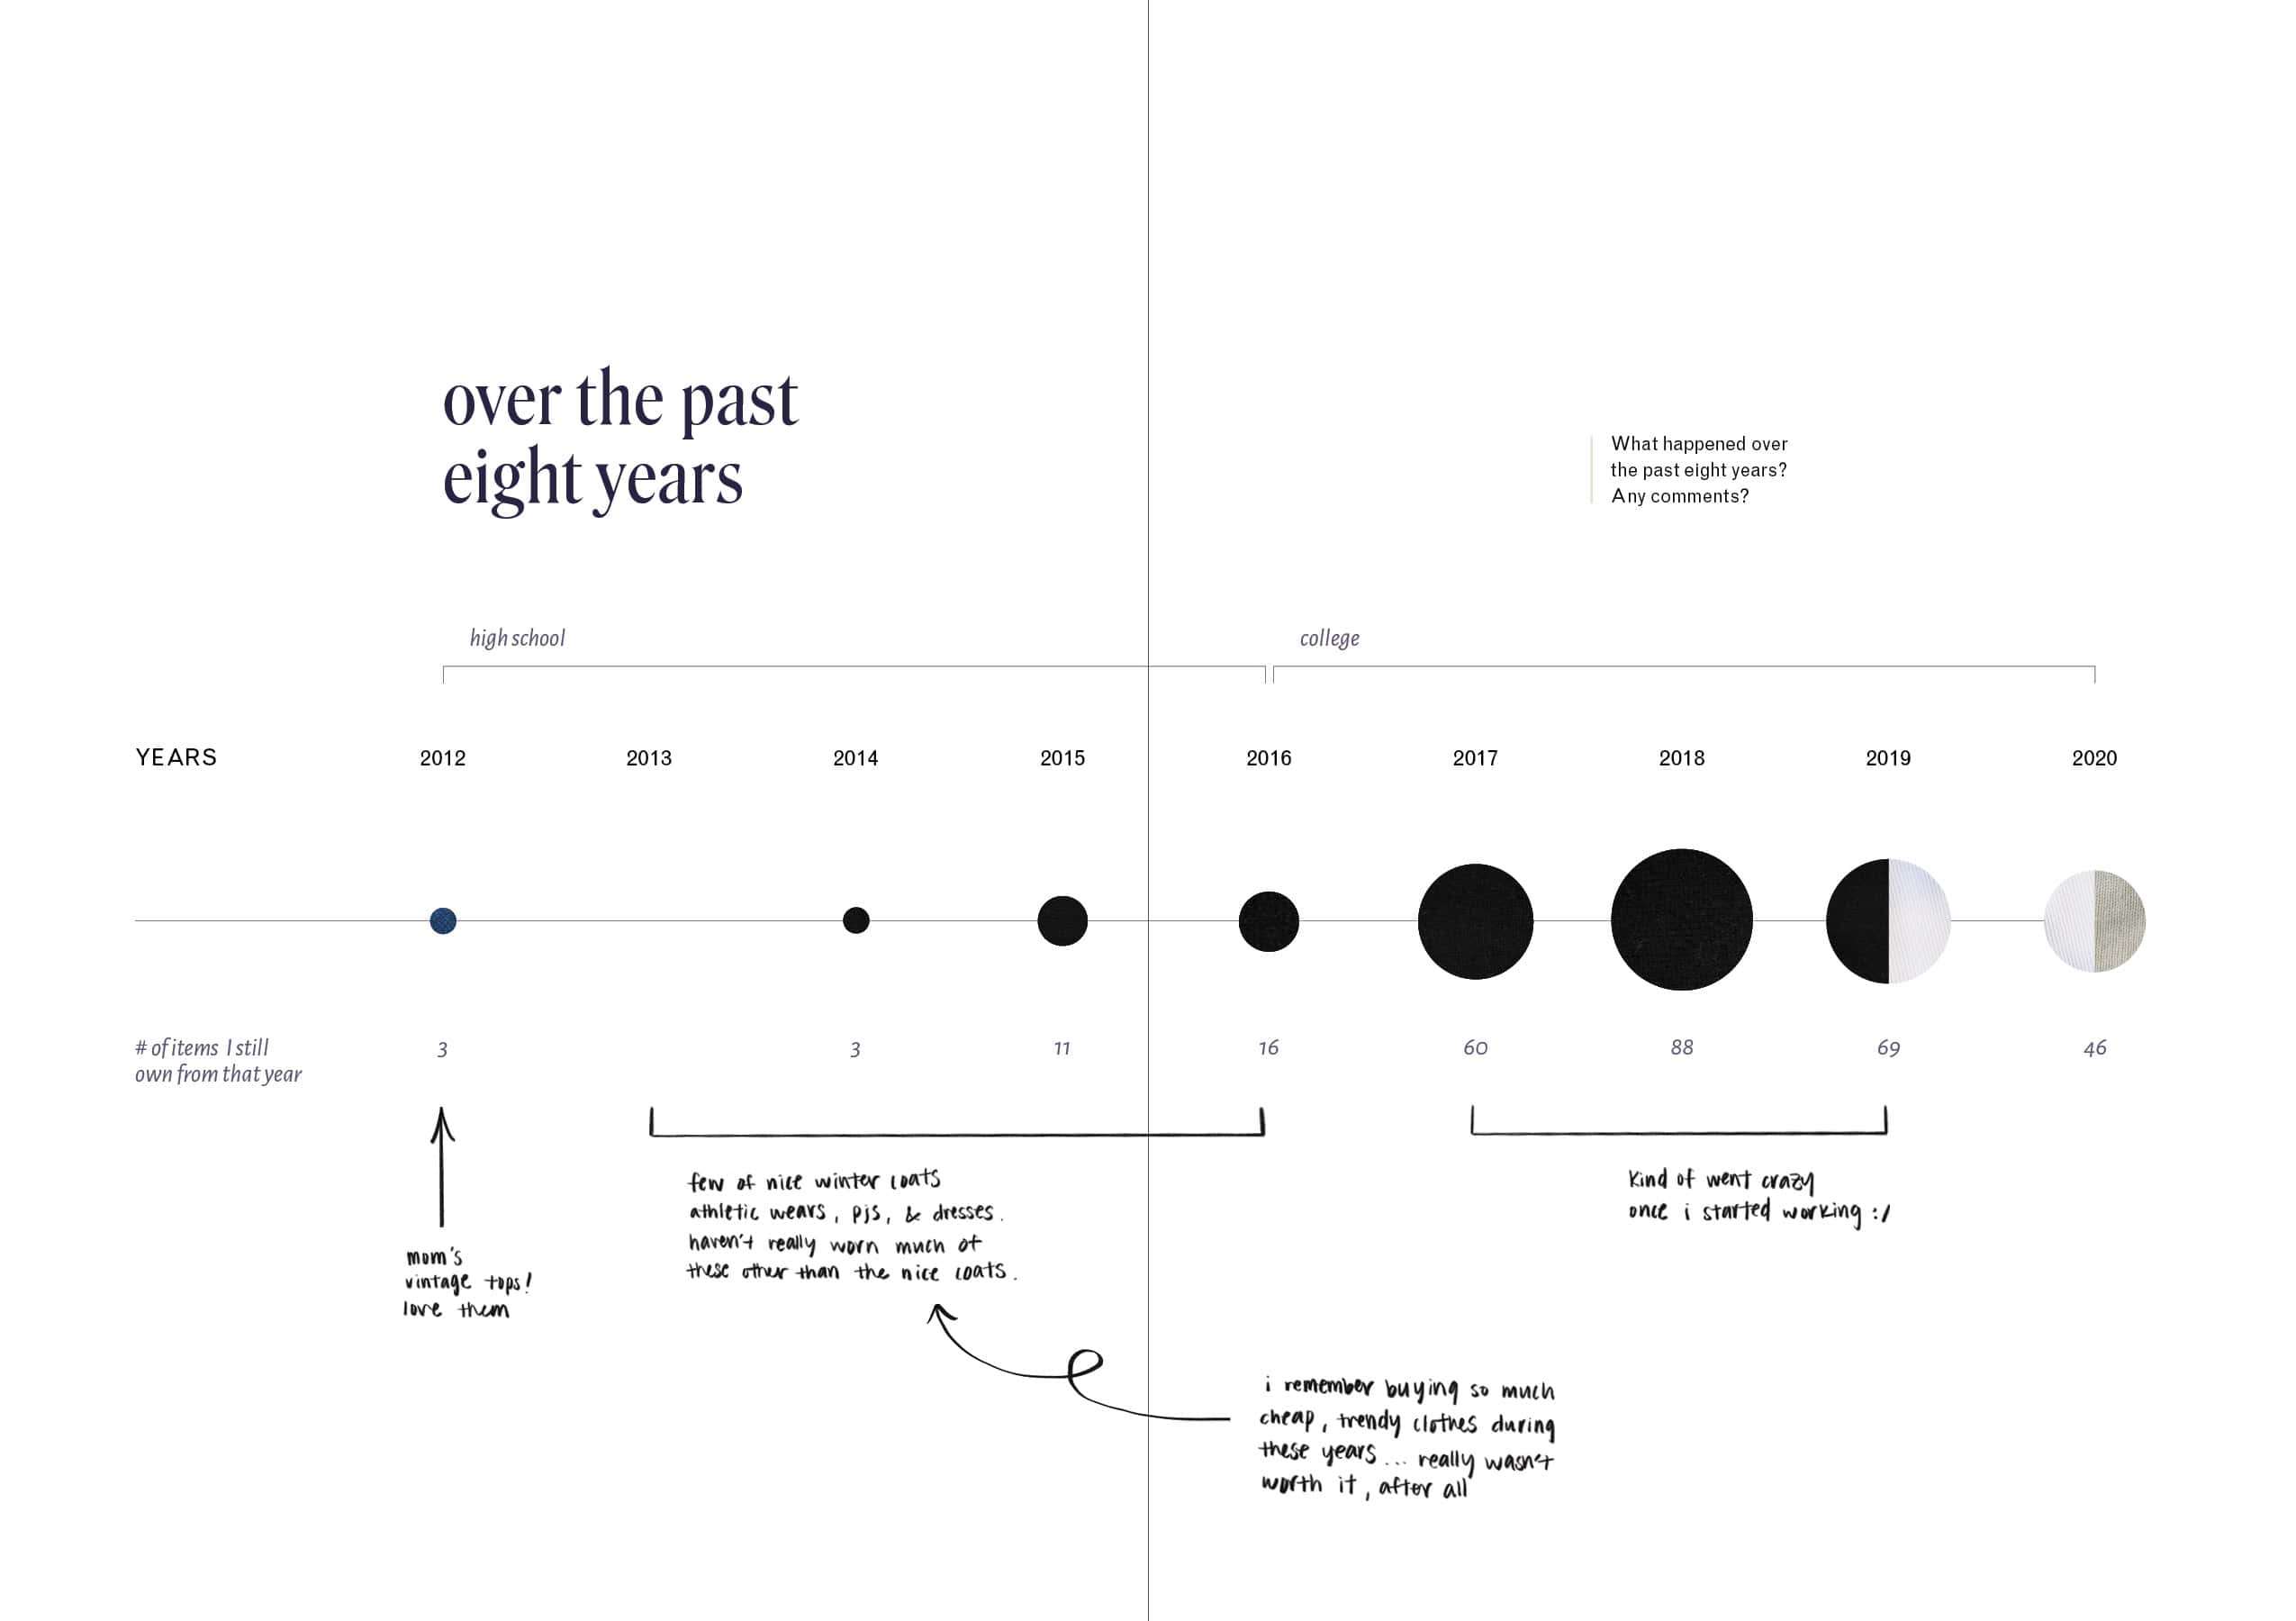
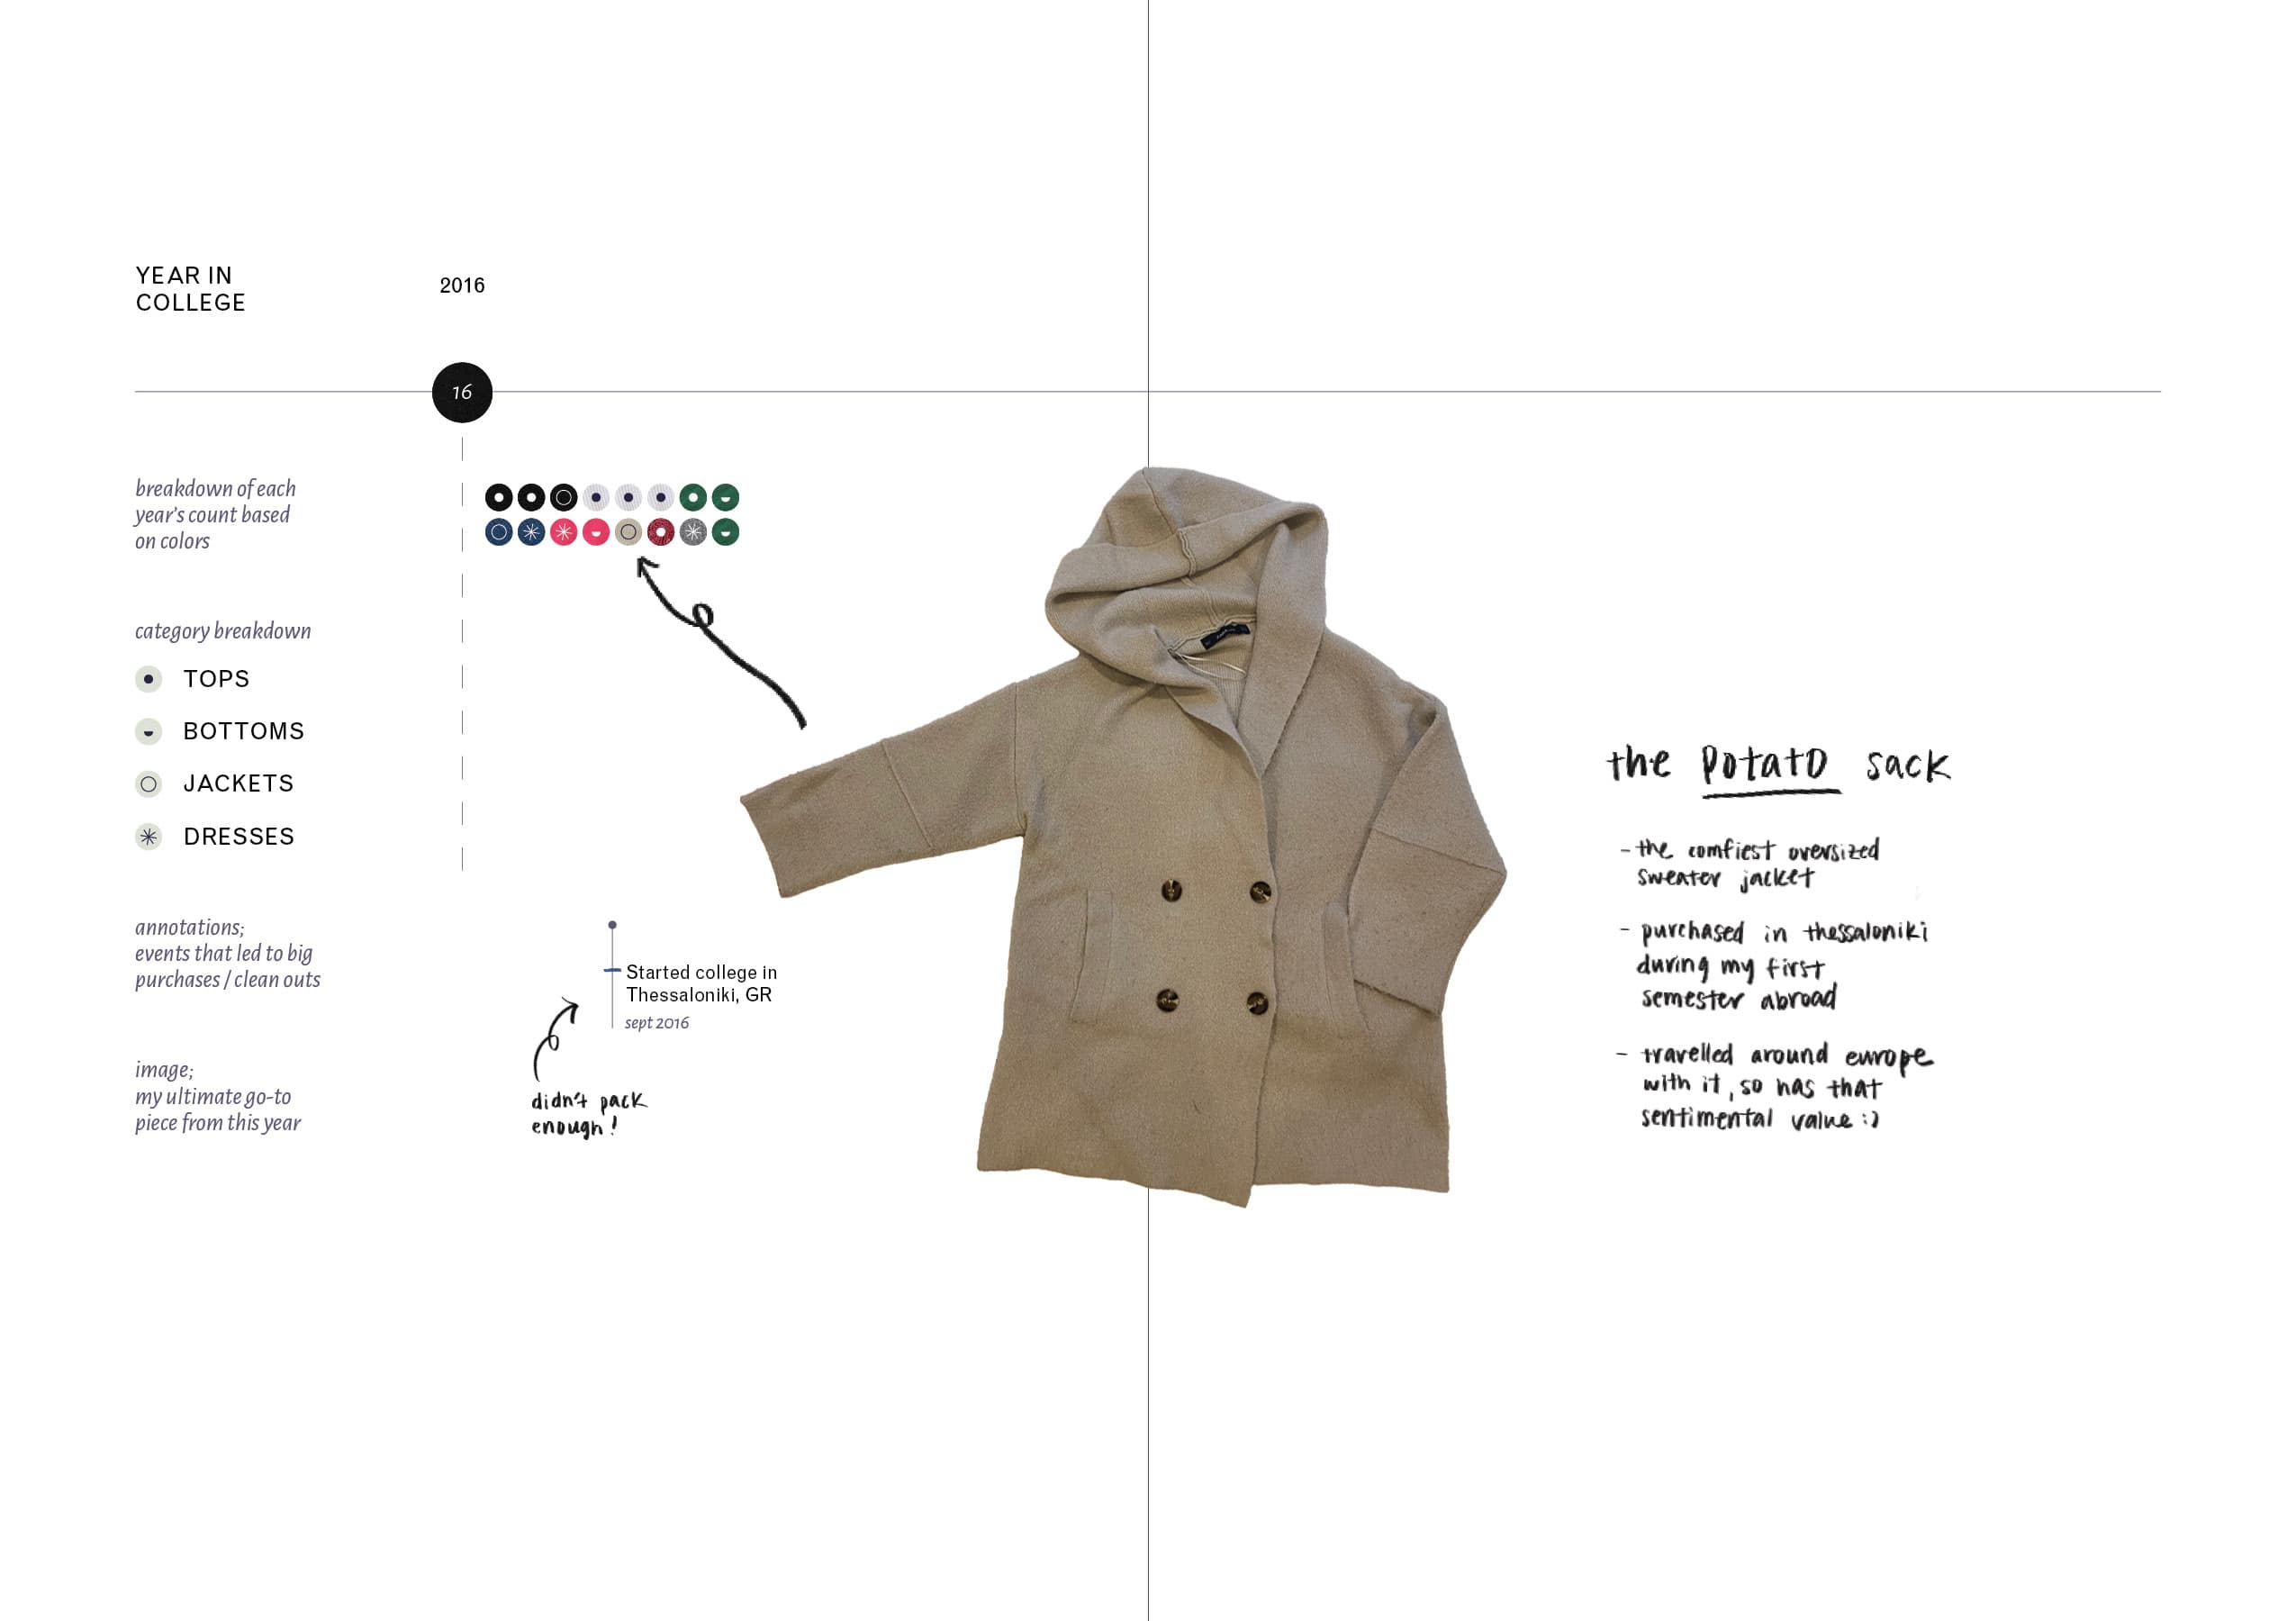
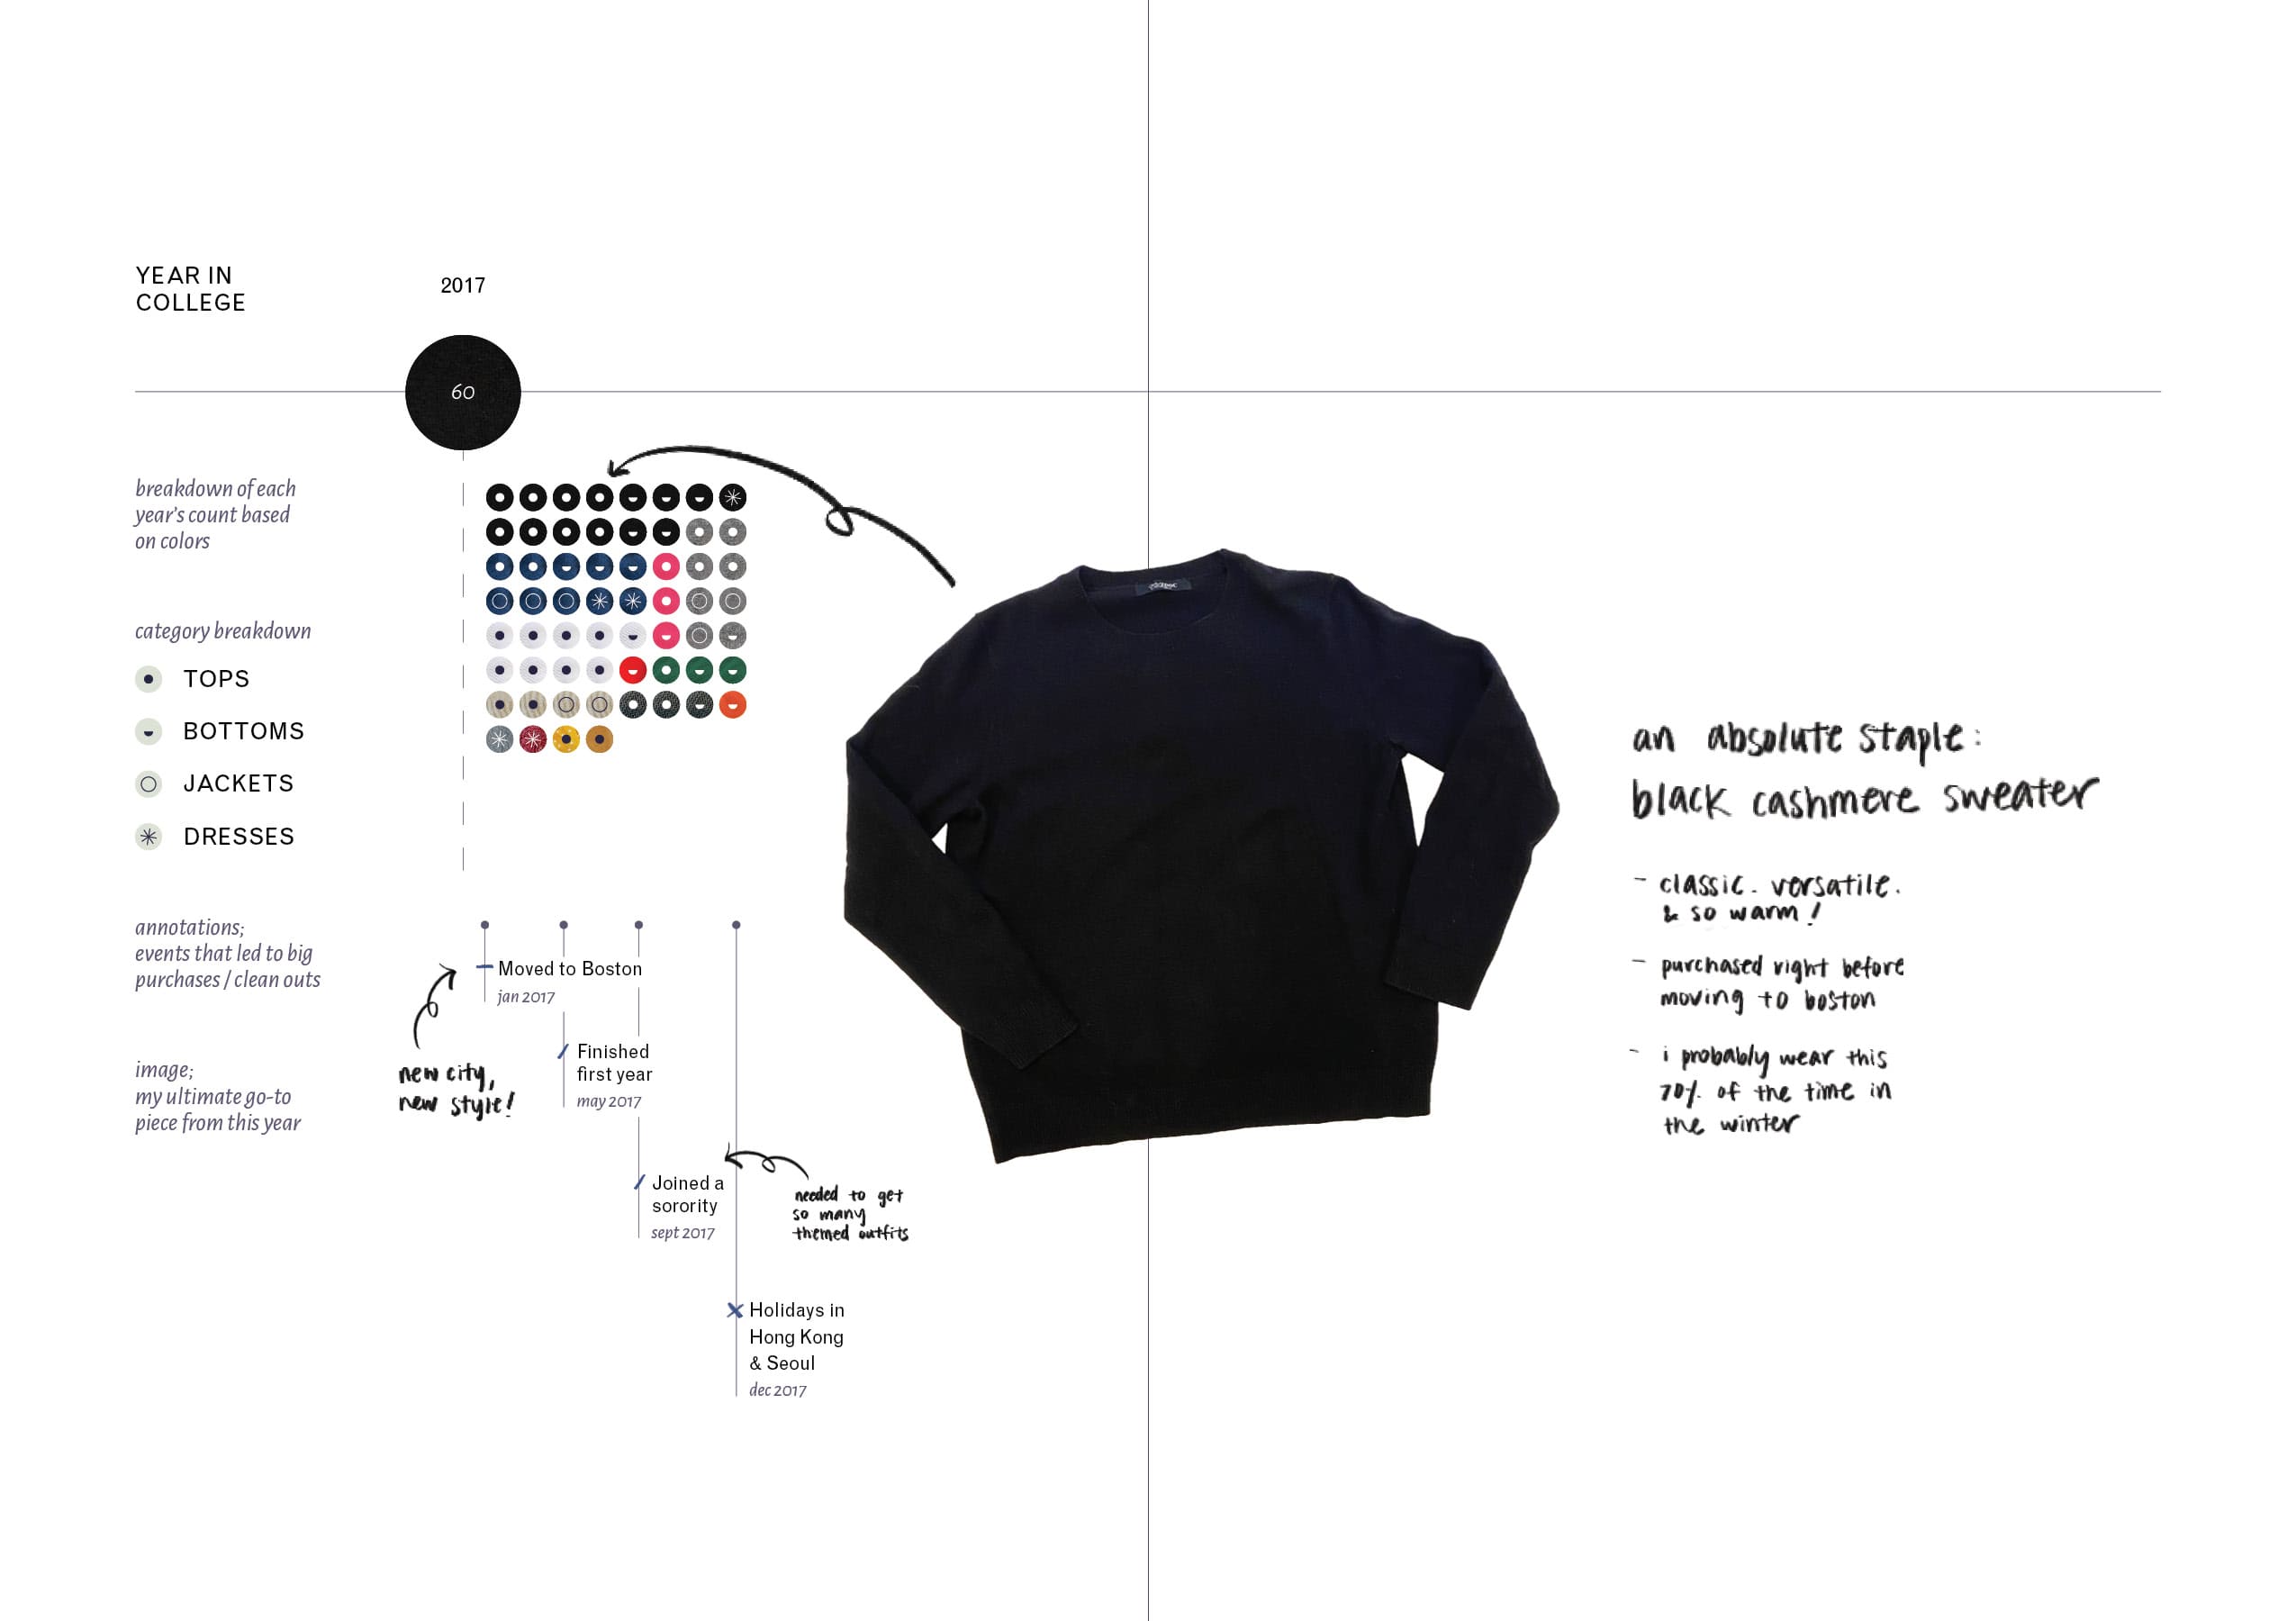
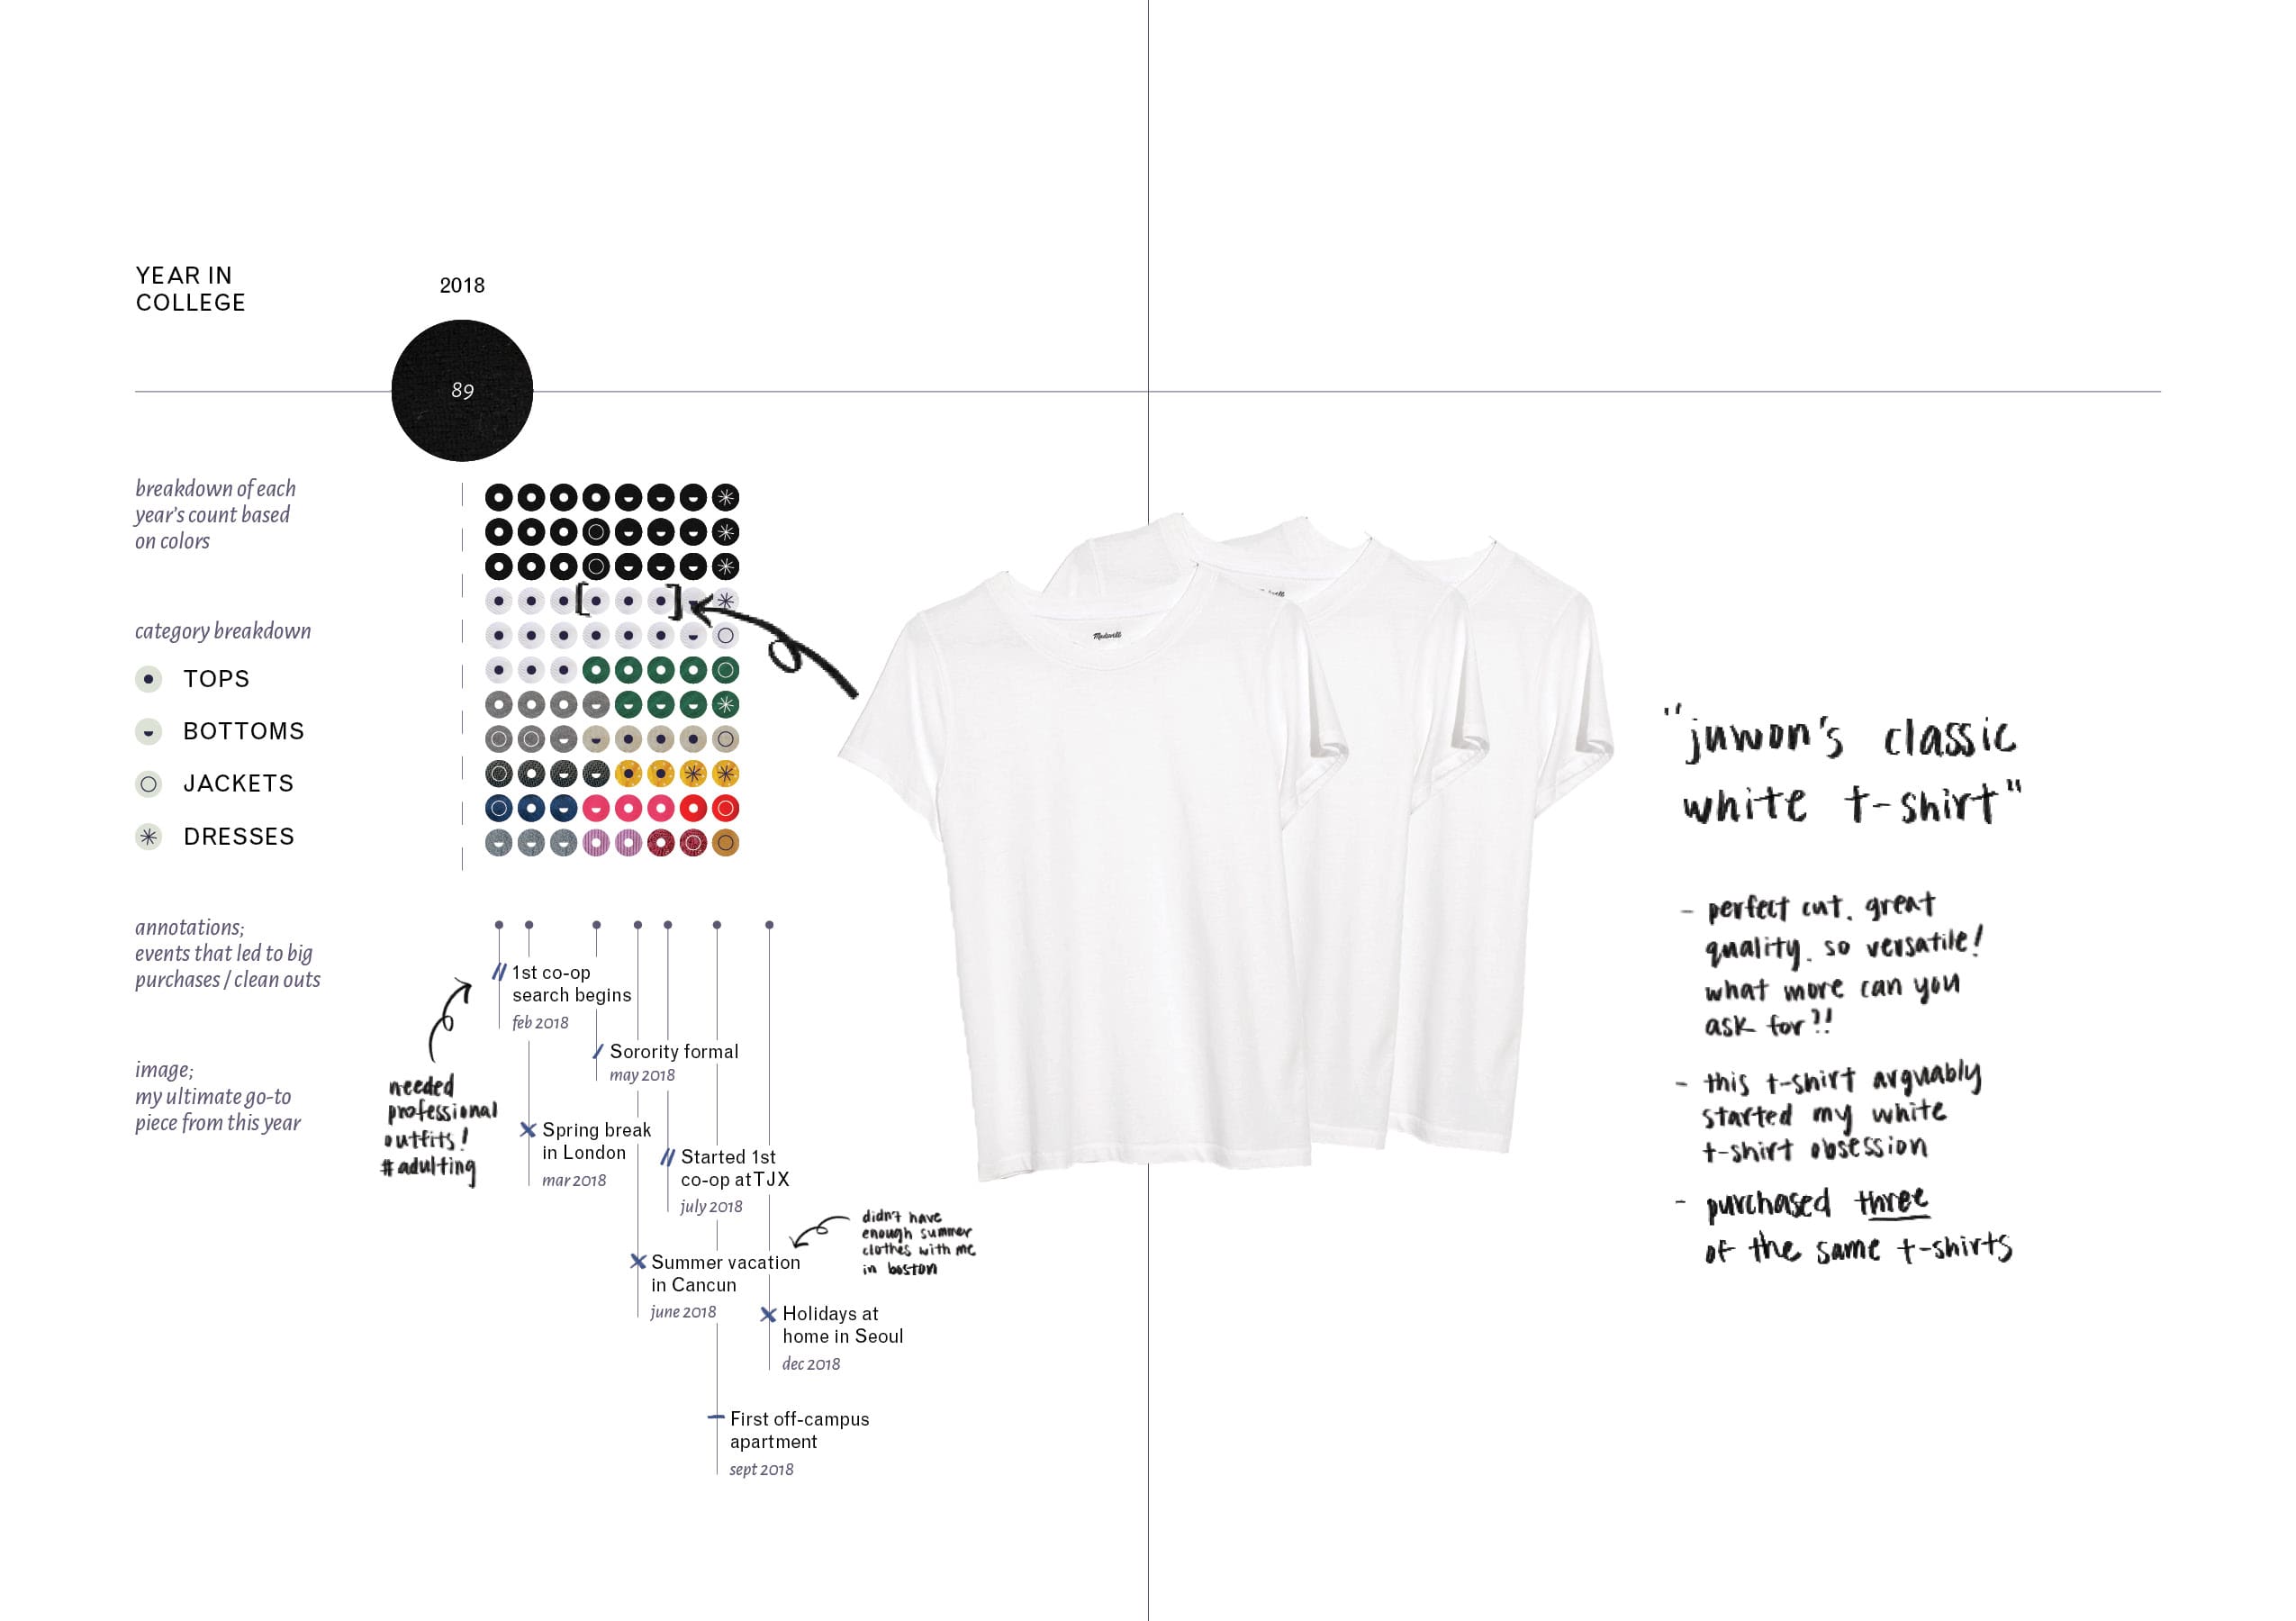
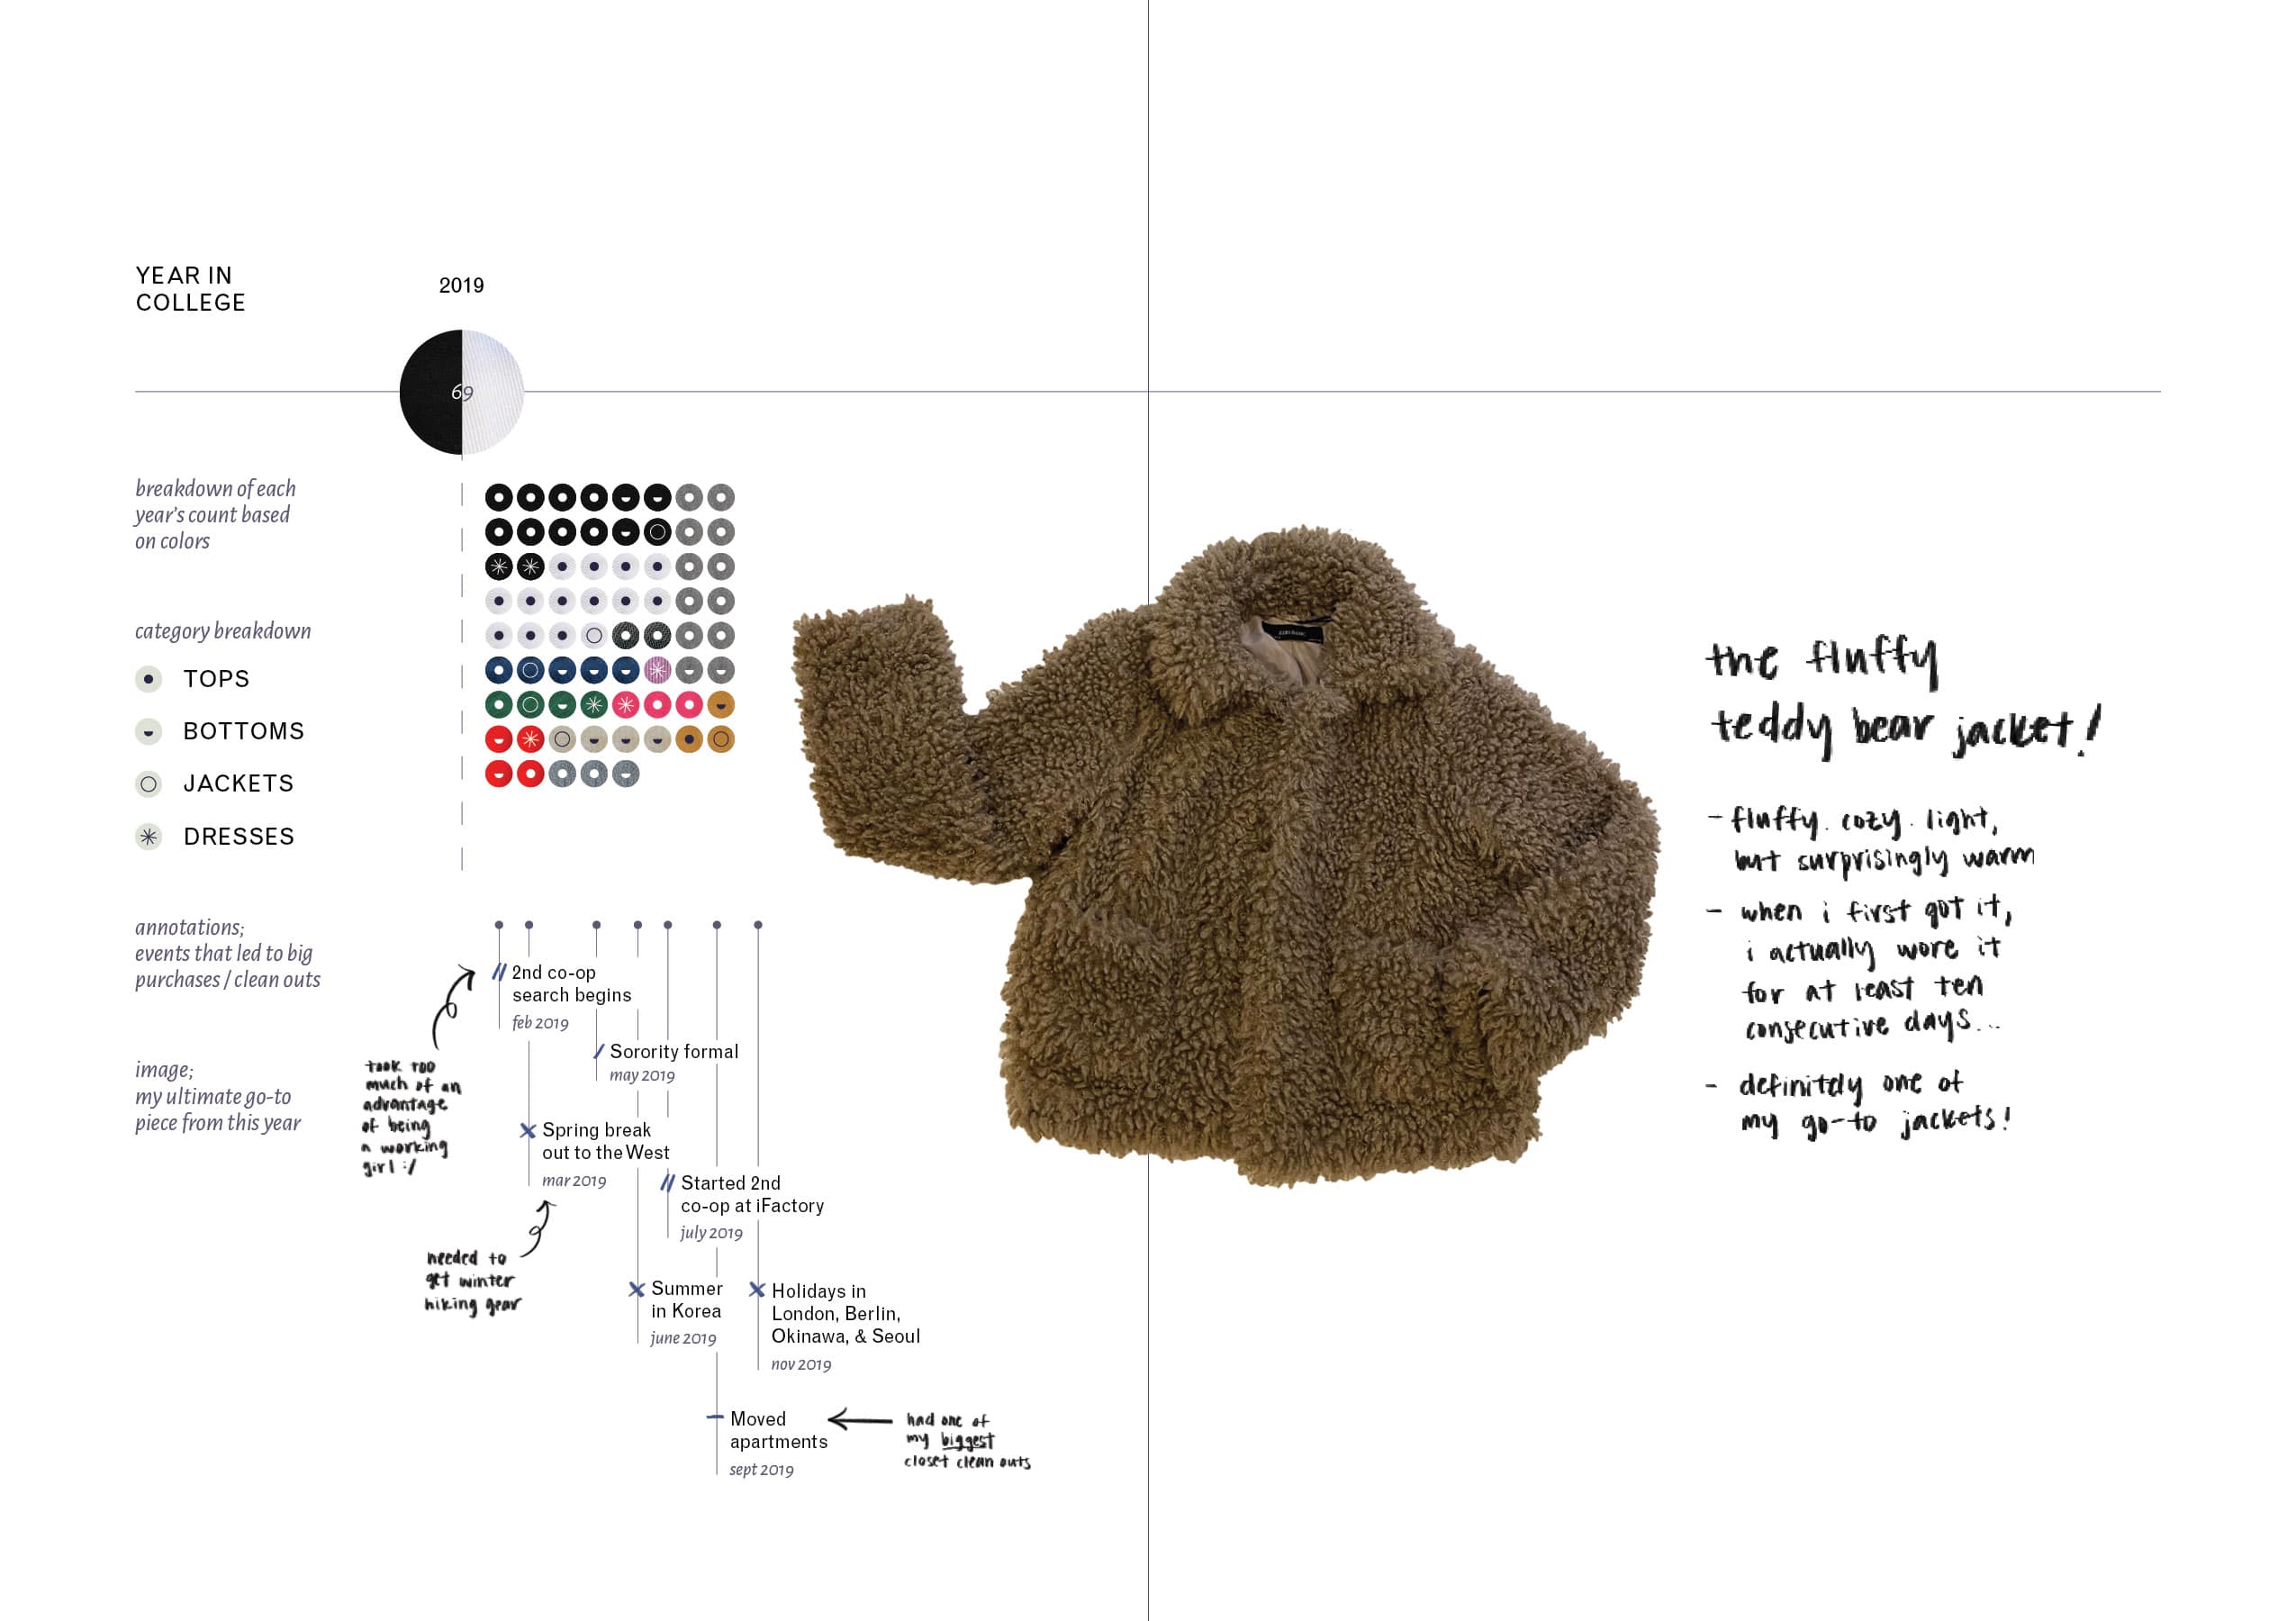
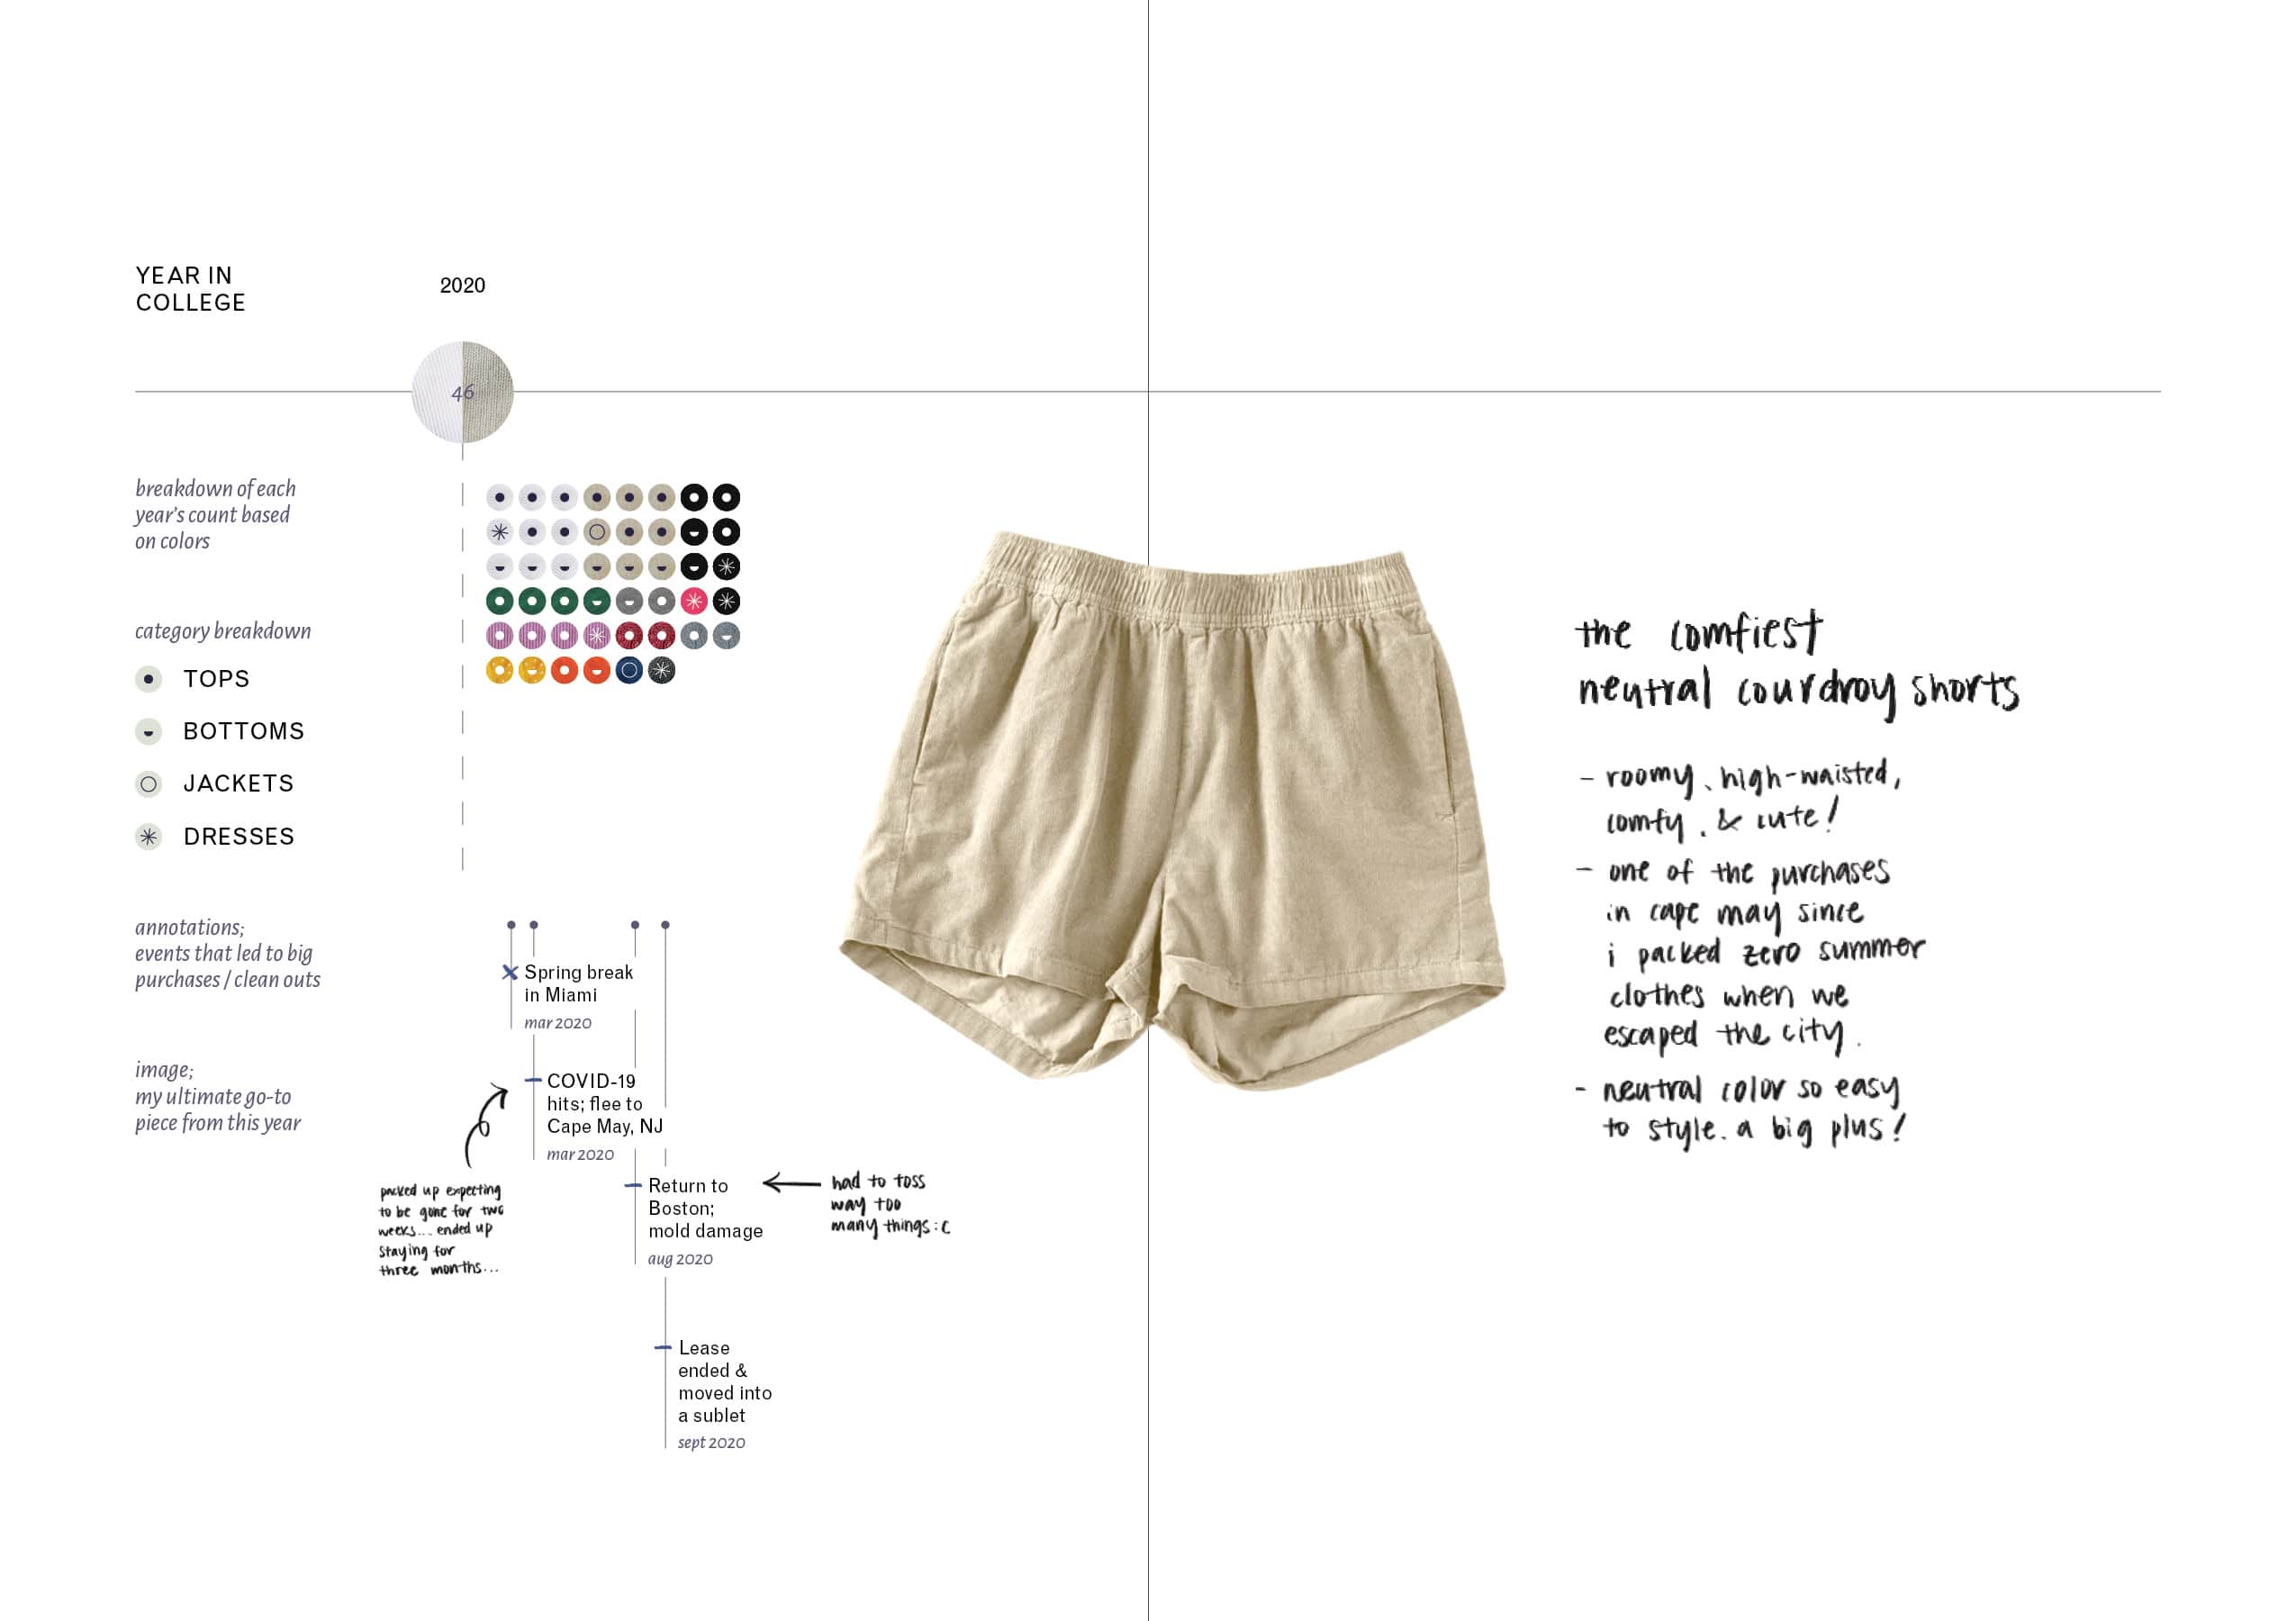
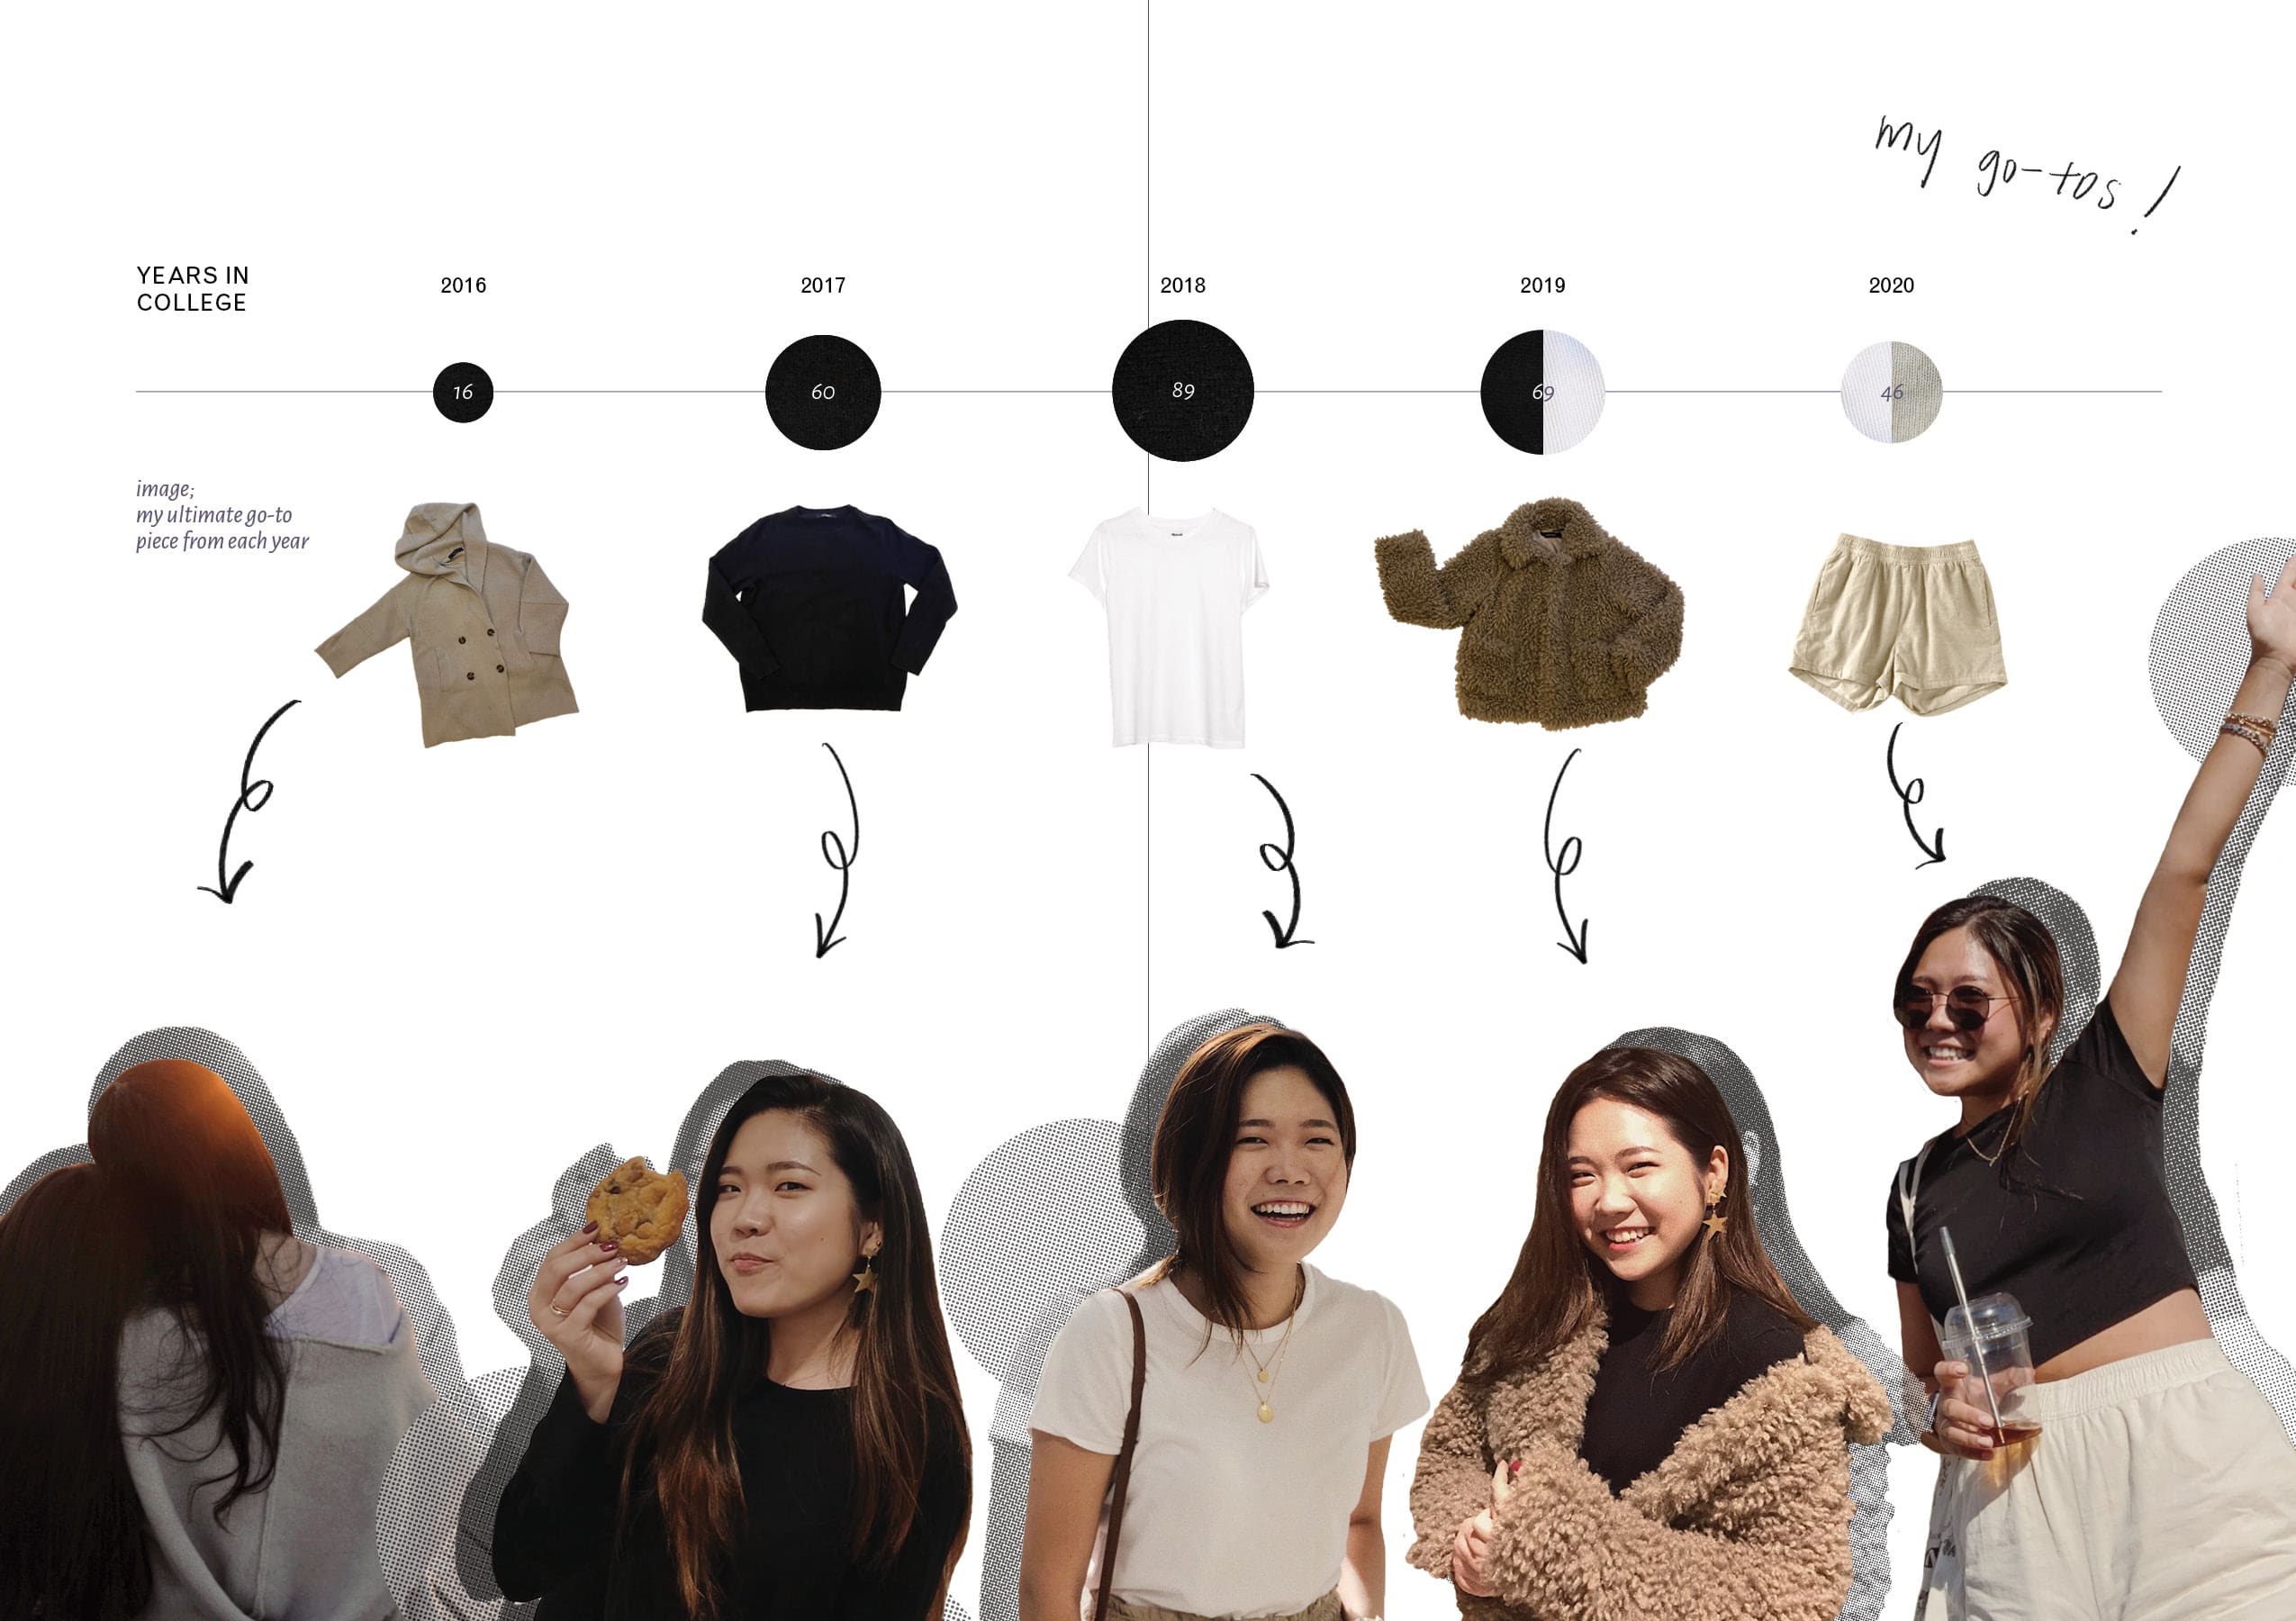
For this "Me, Myself, and My Wardrobe" project, I created a data visualization booklet that illustrates a reflection of myself through my closet.
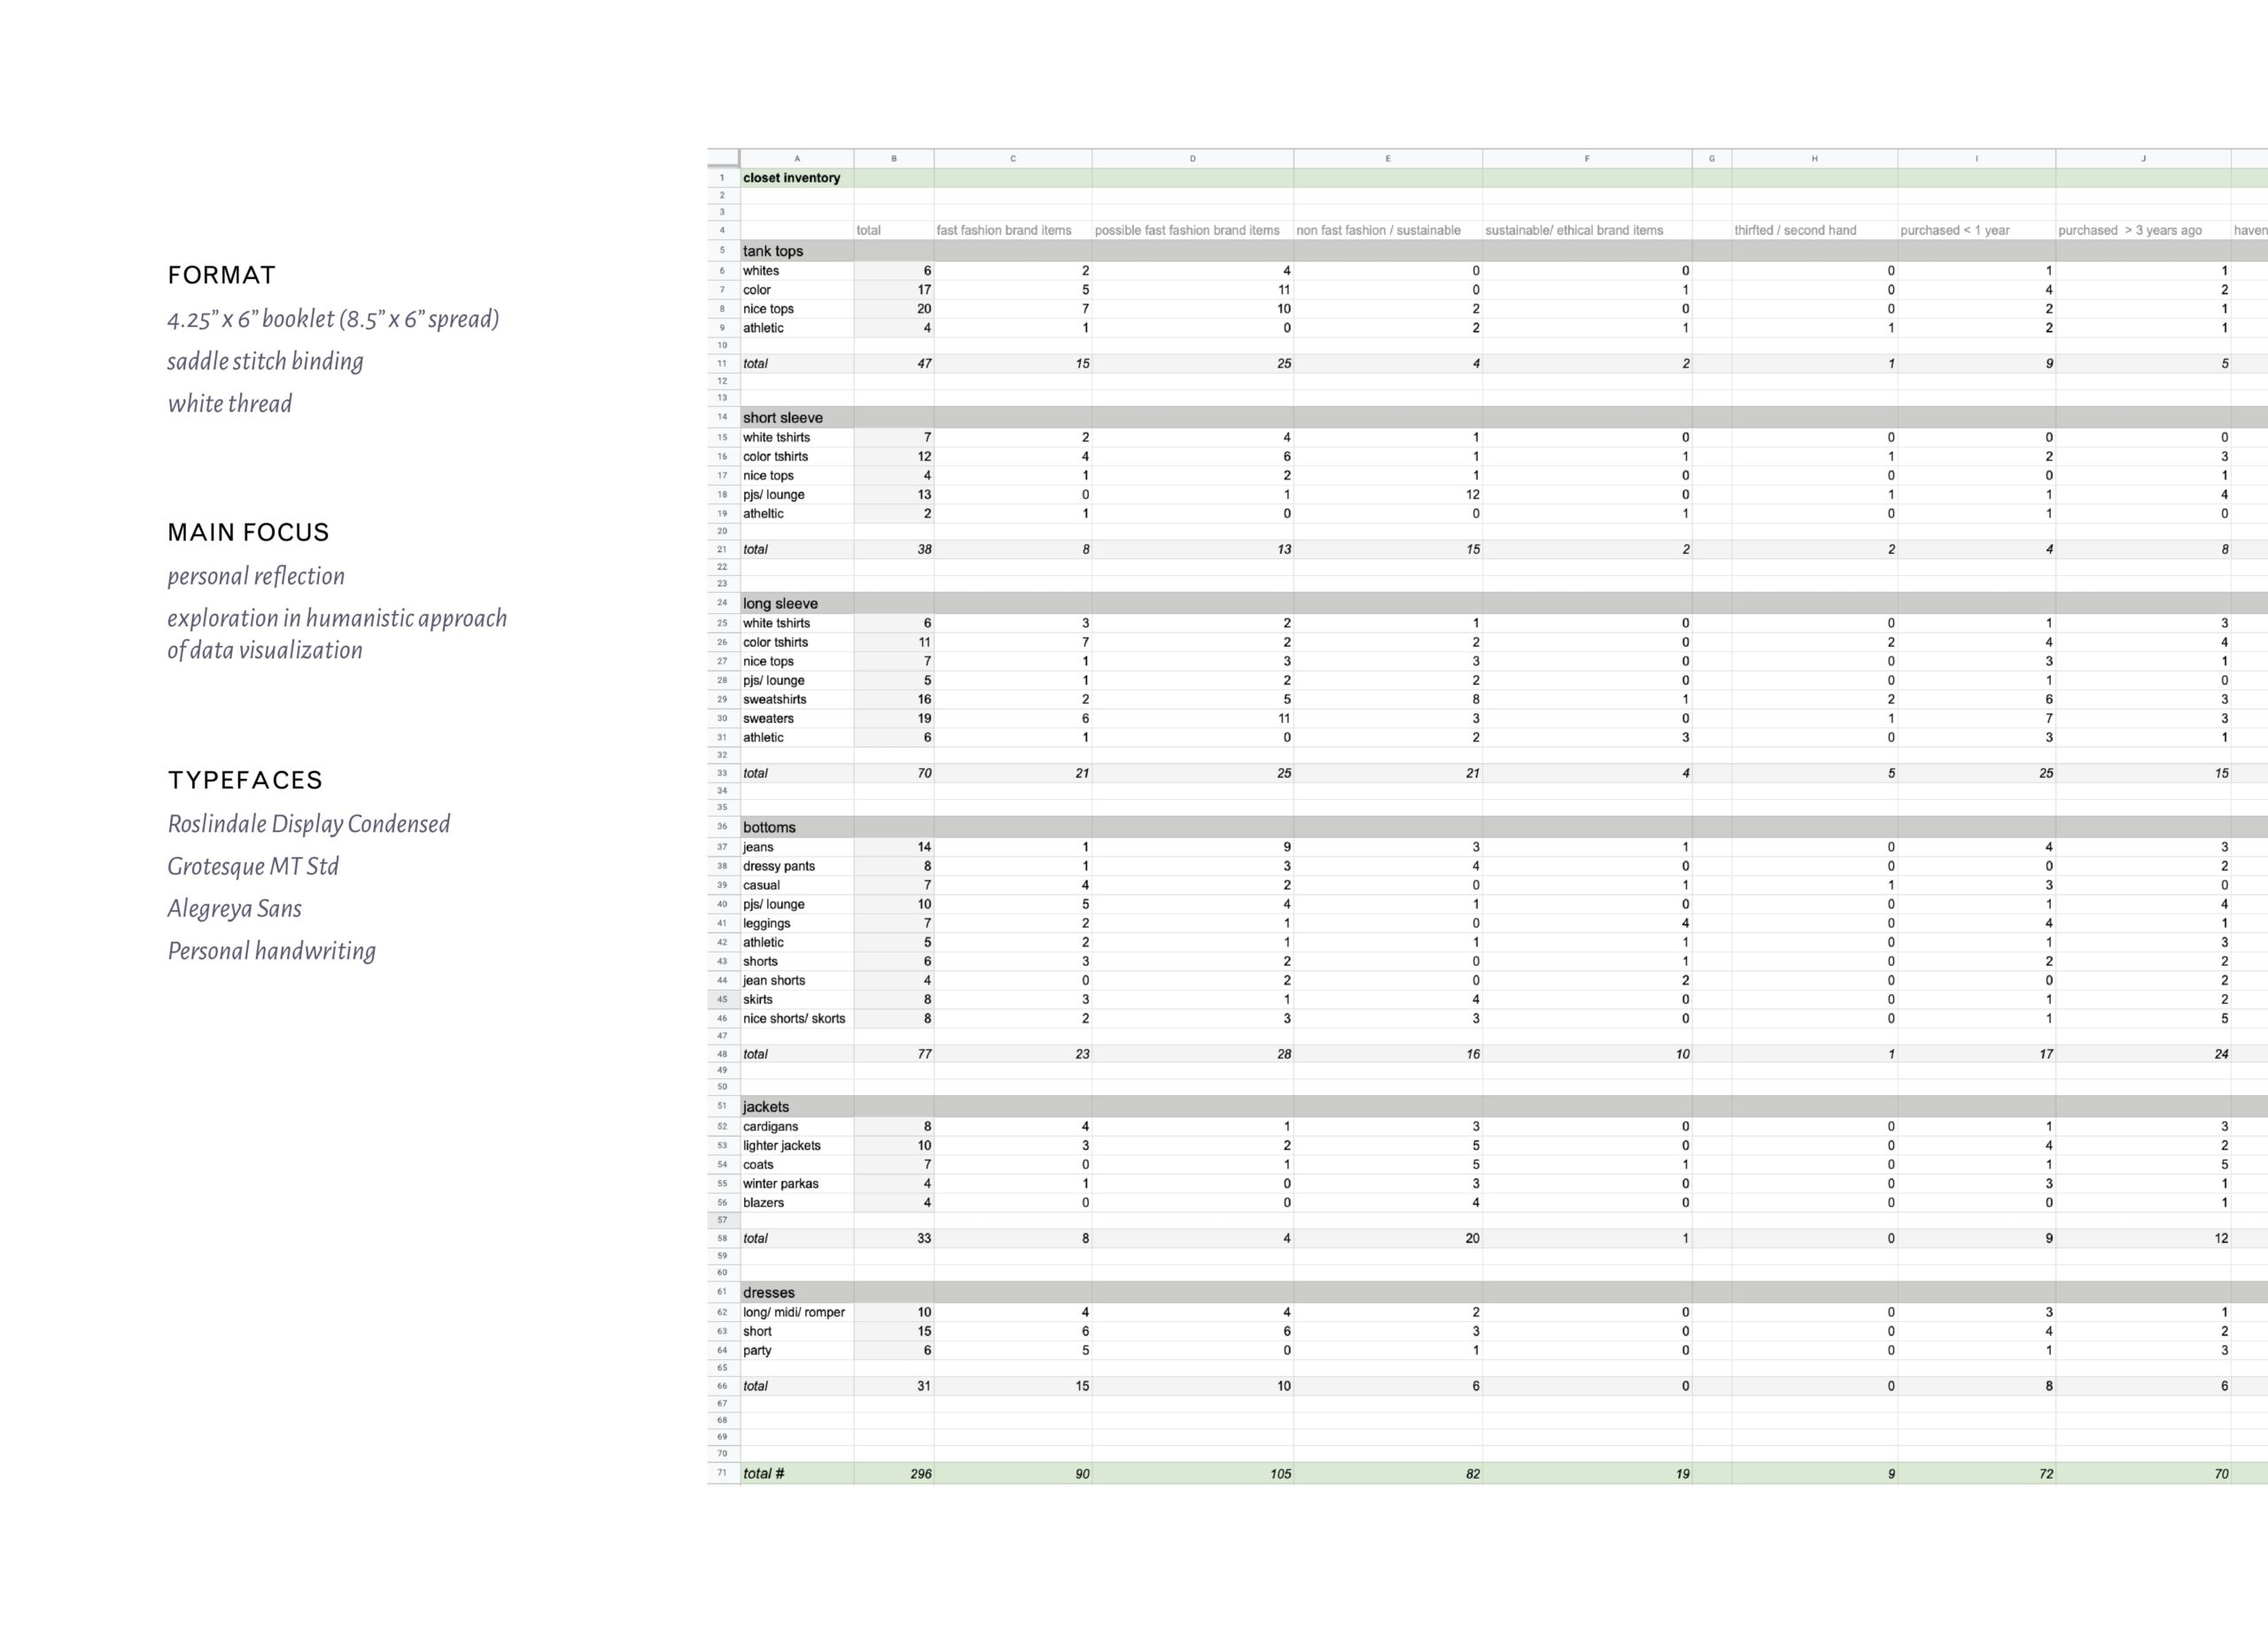
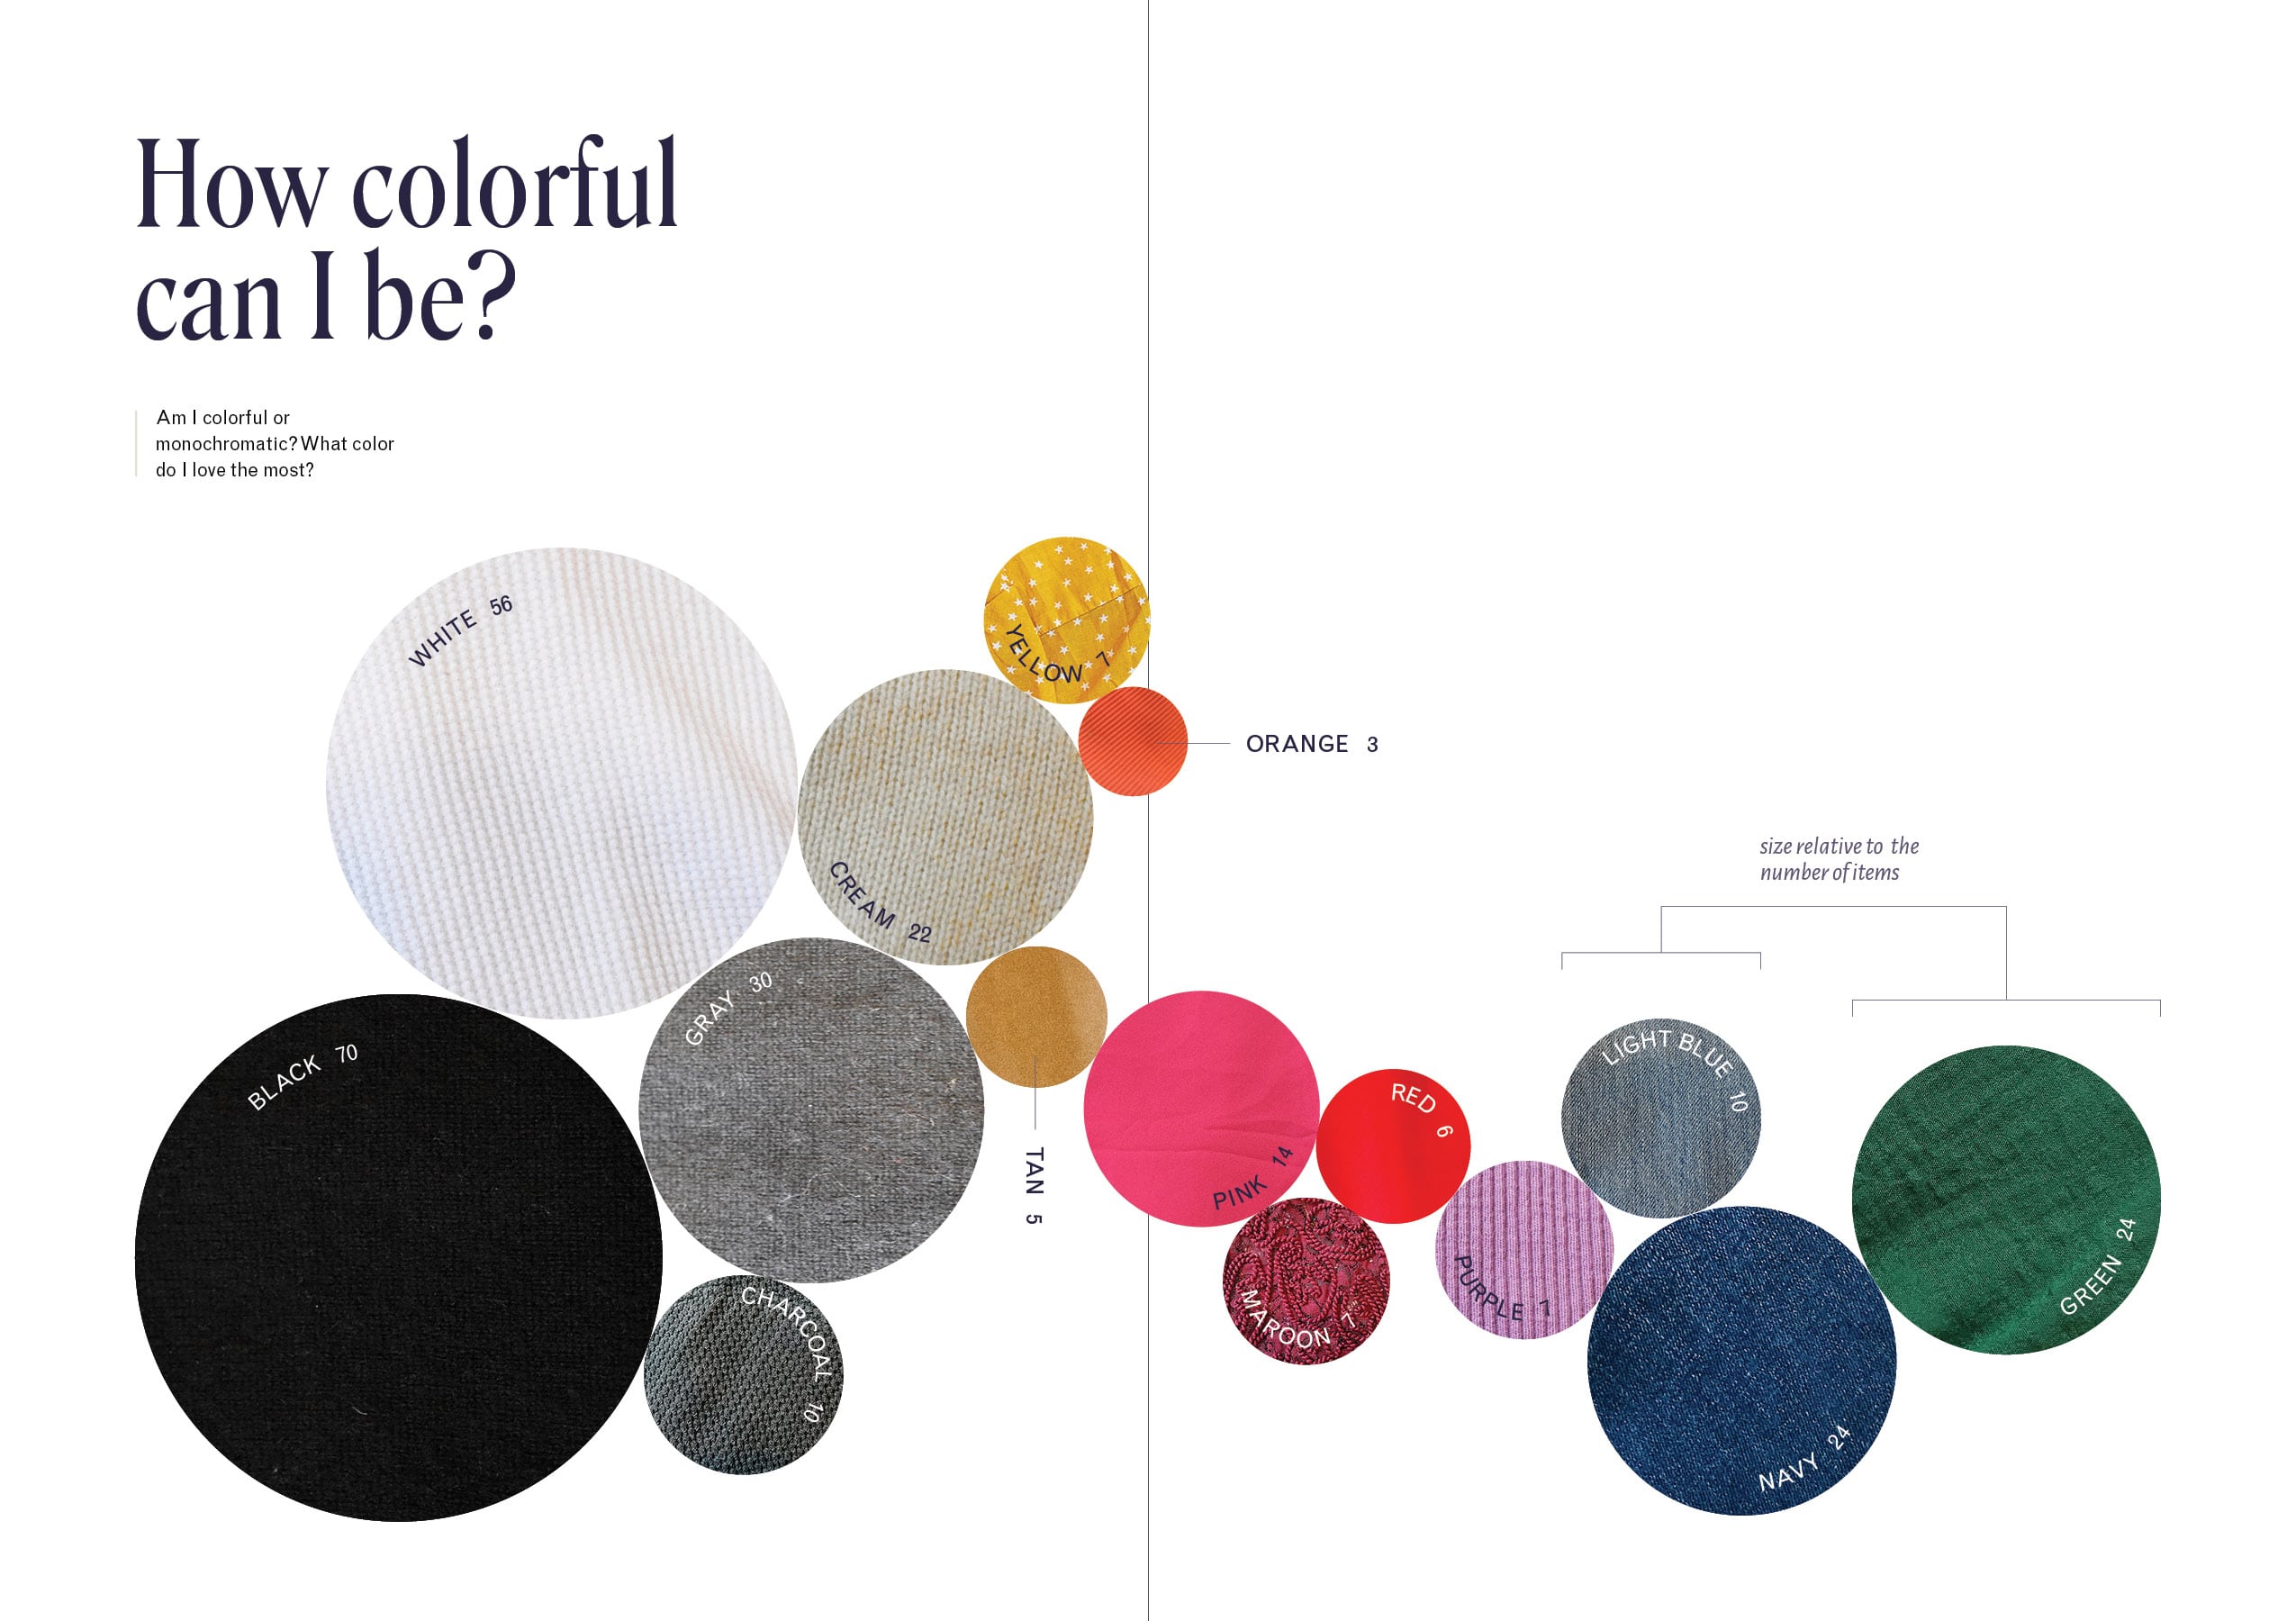
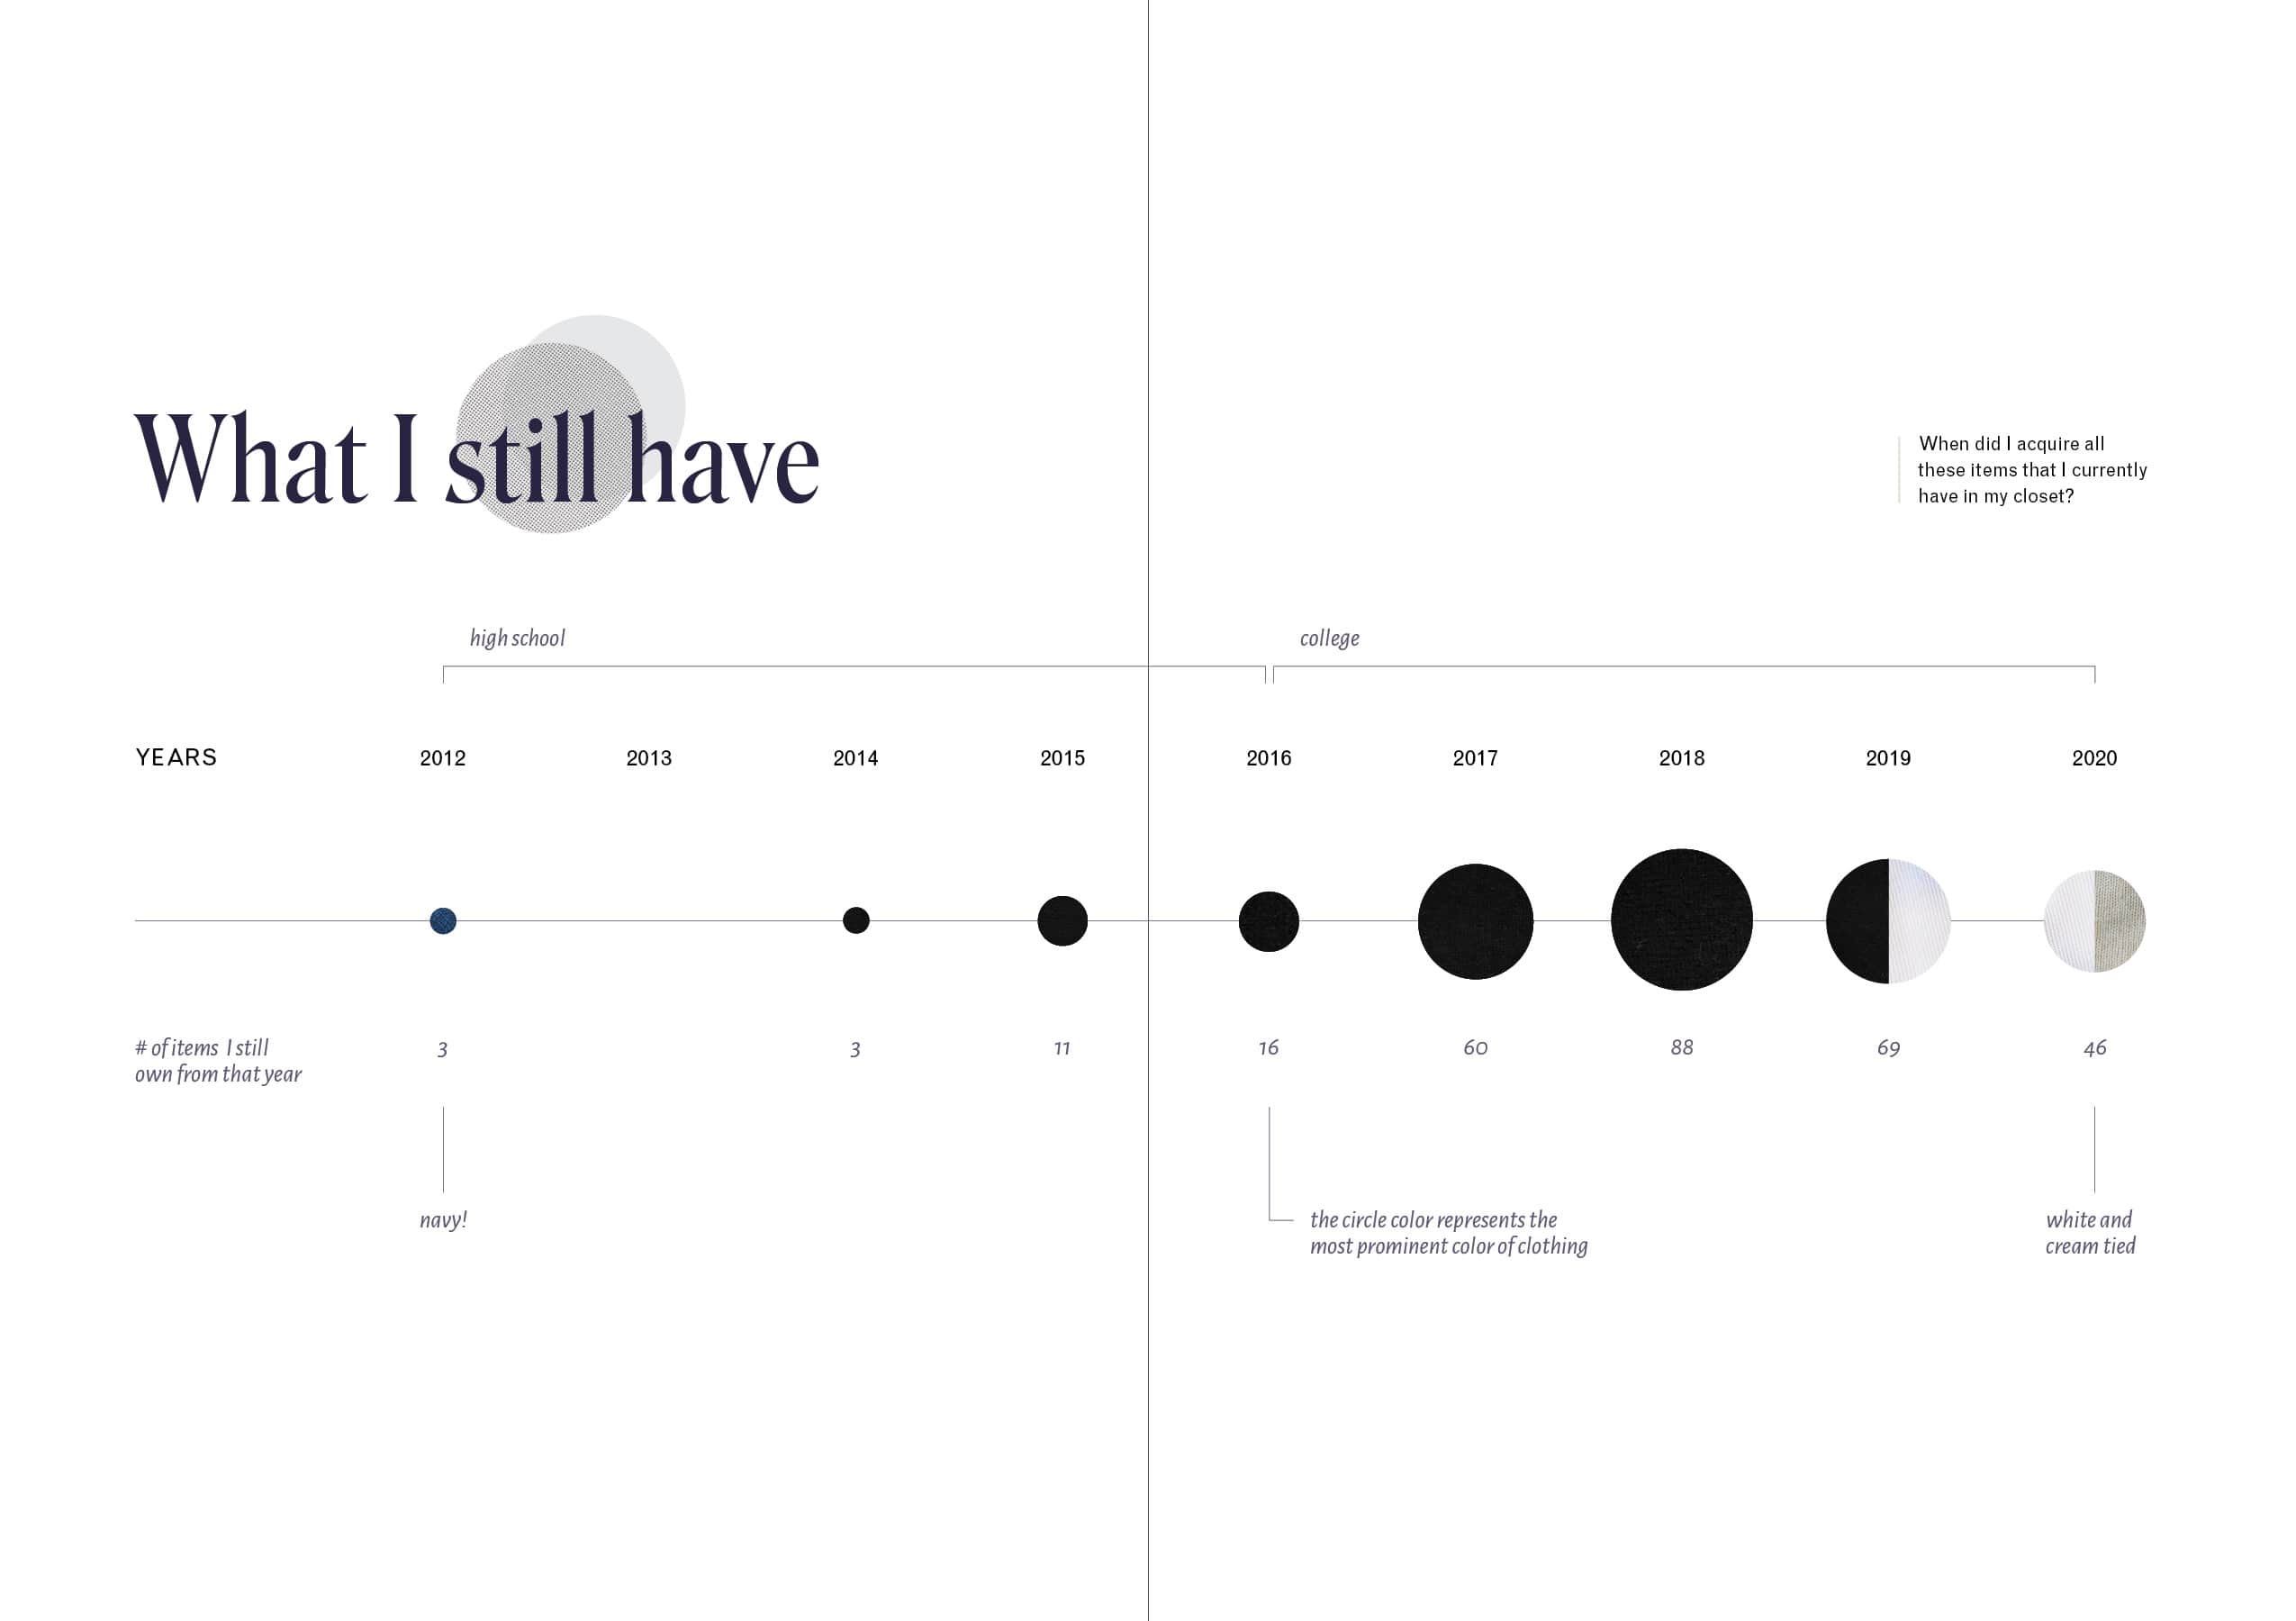
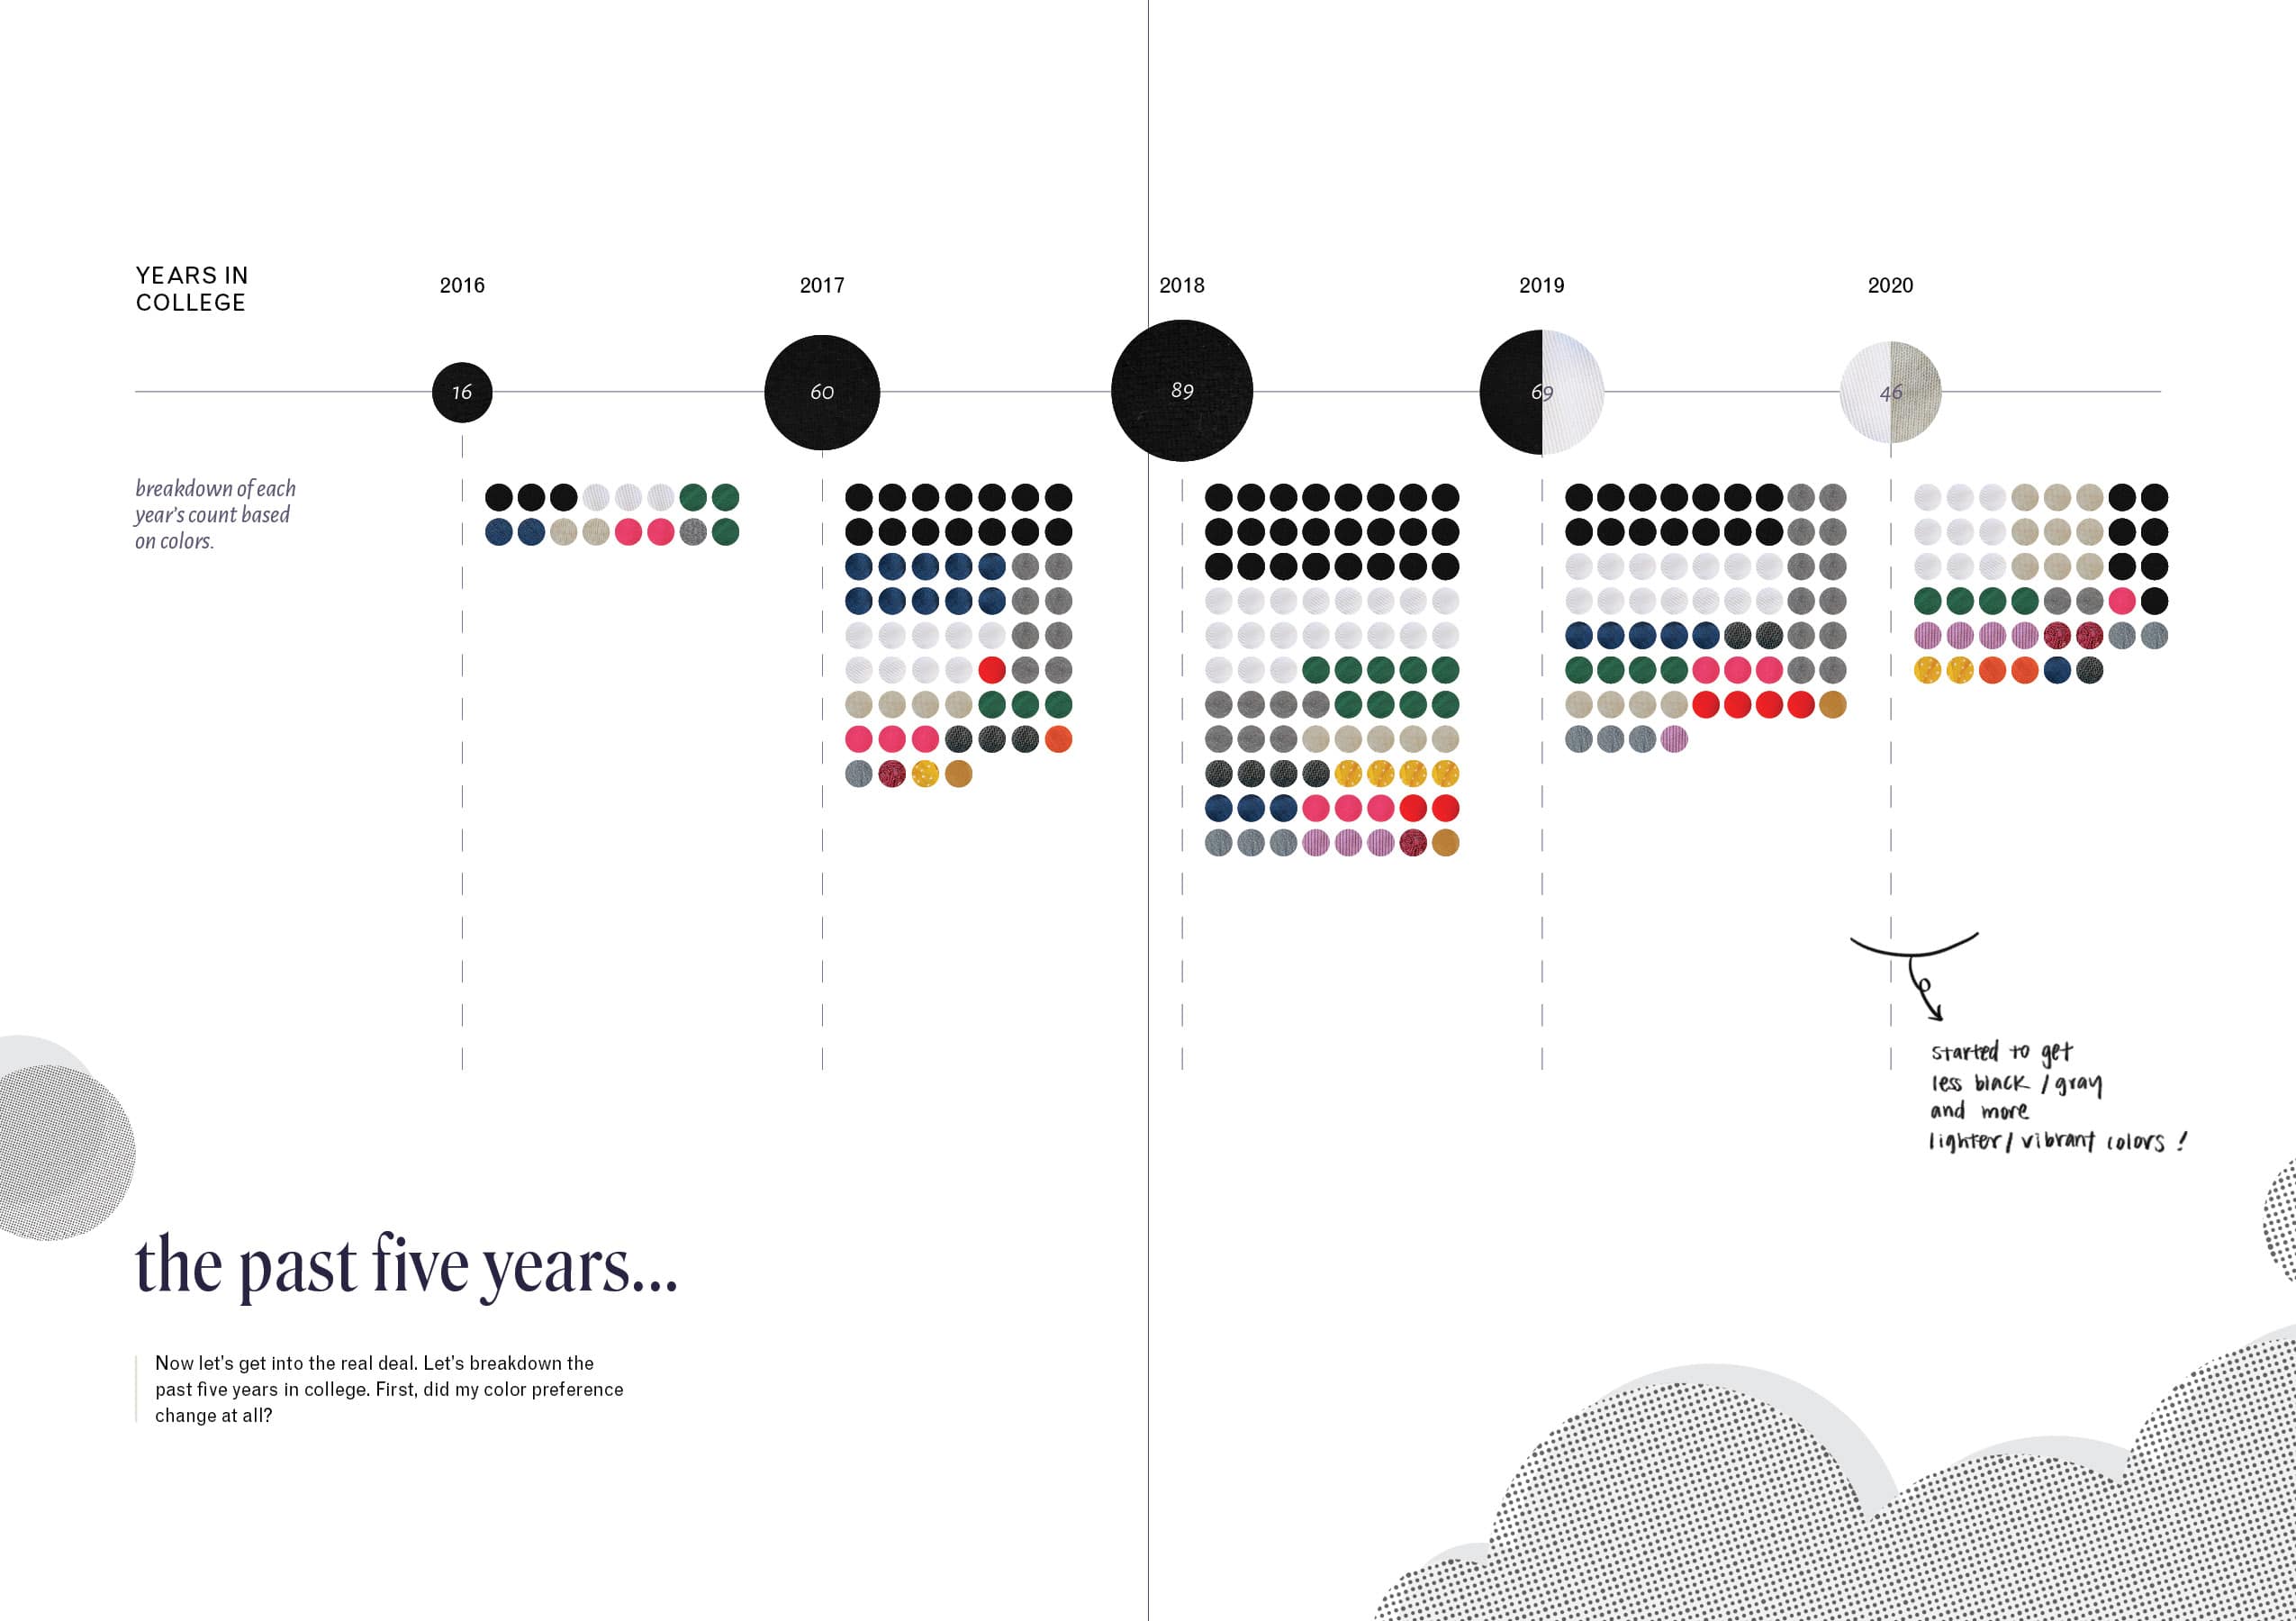
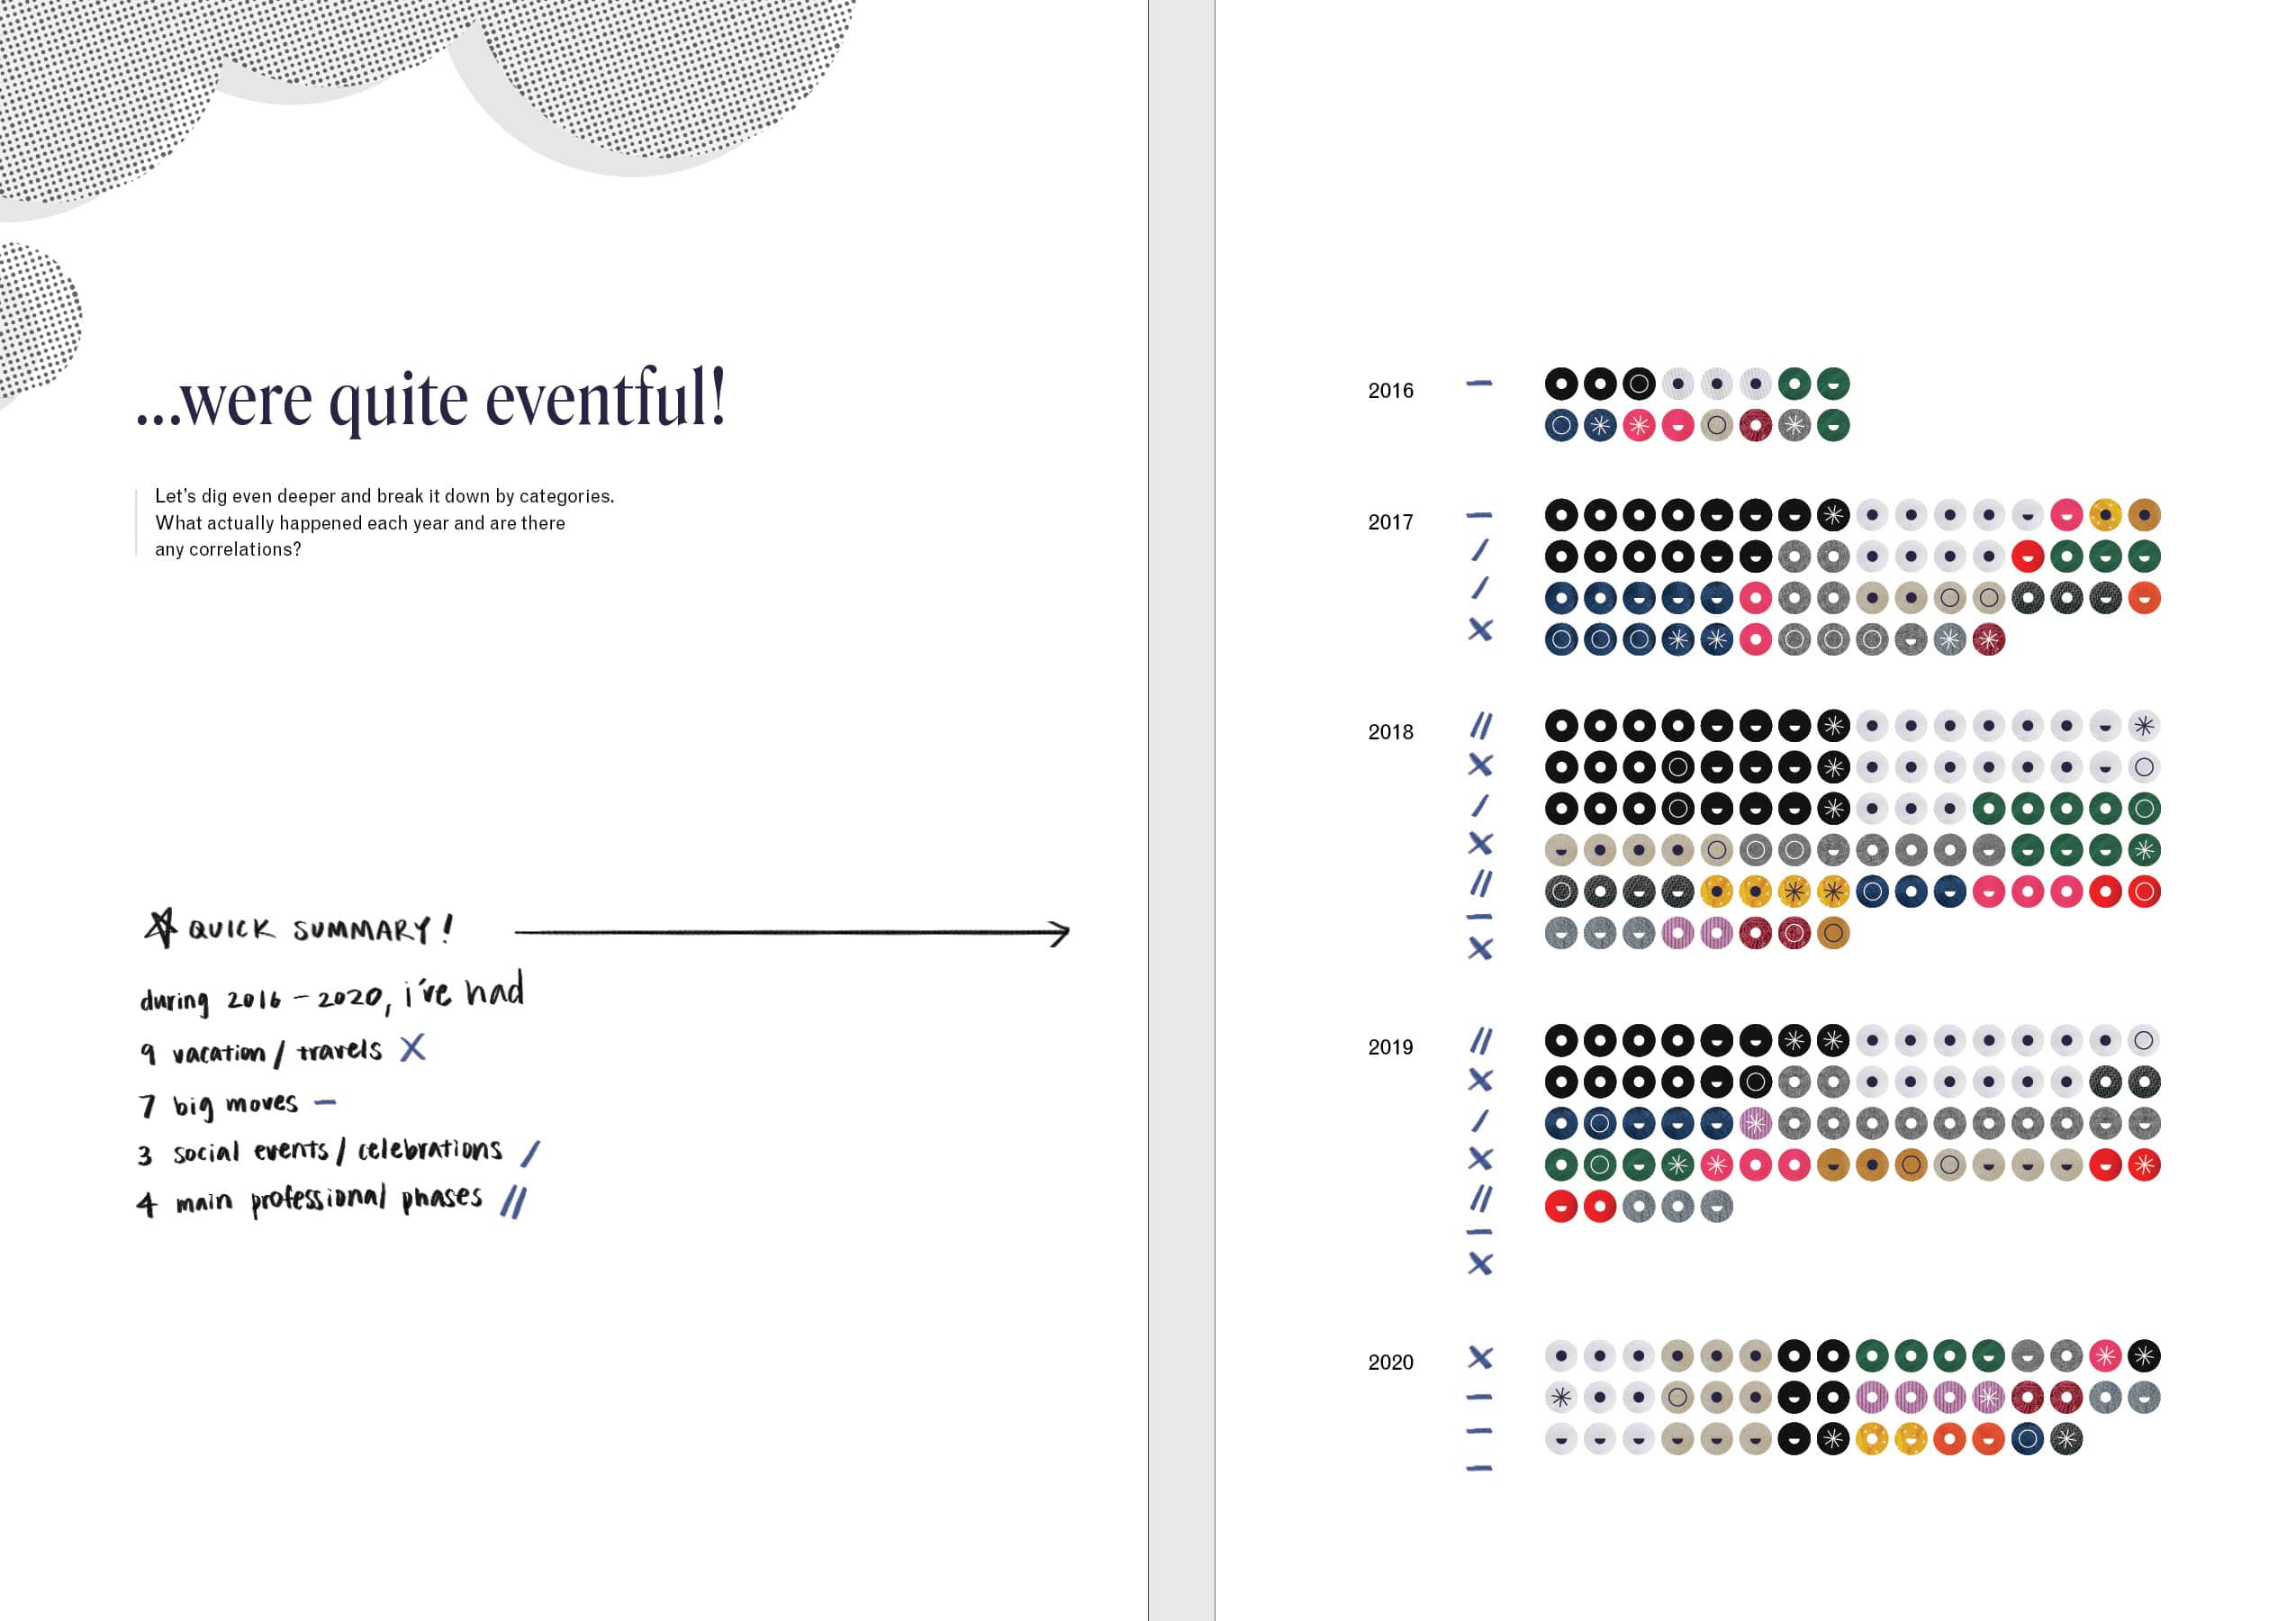
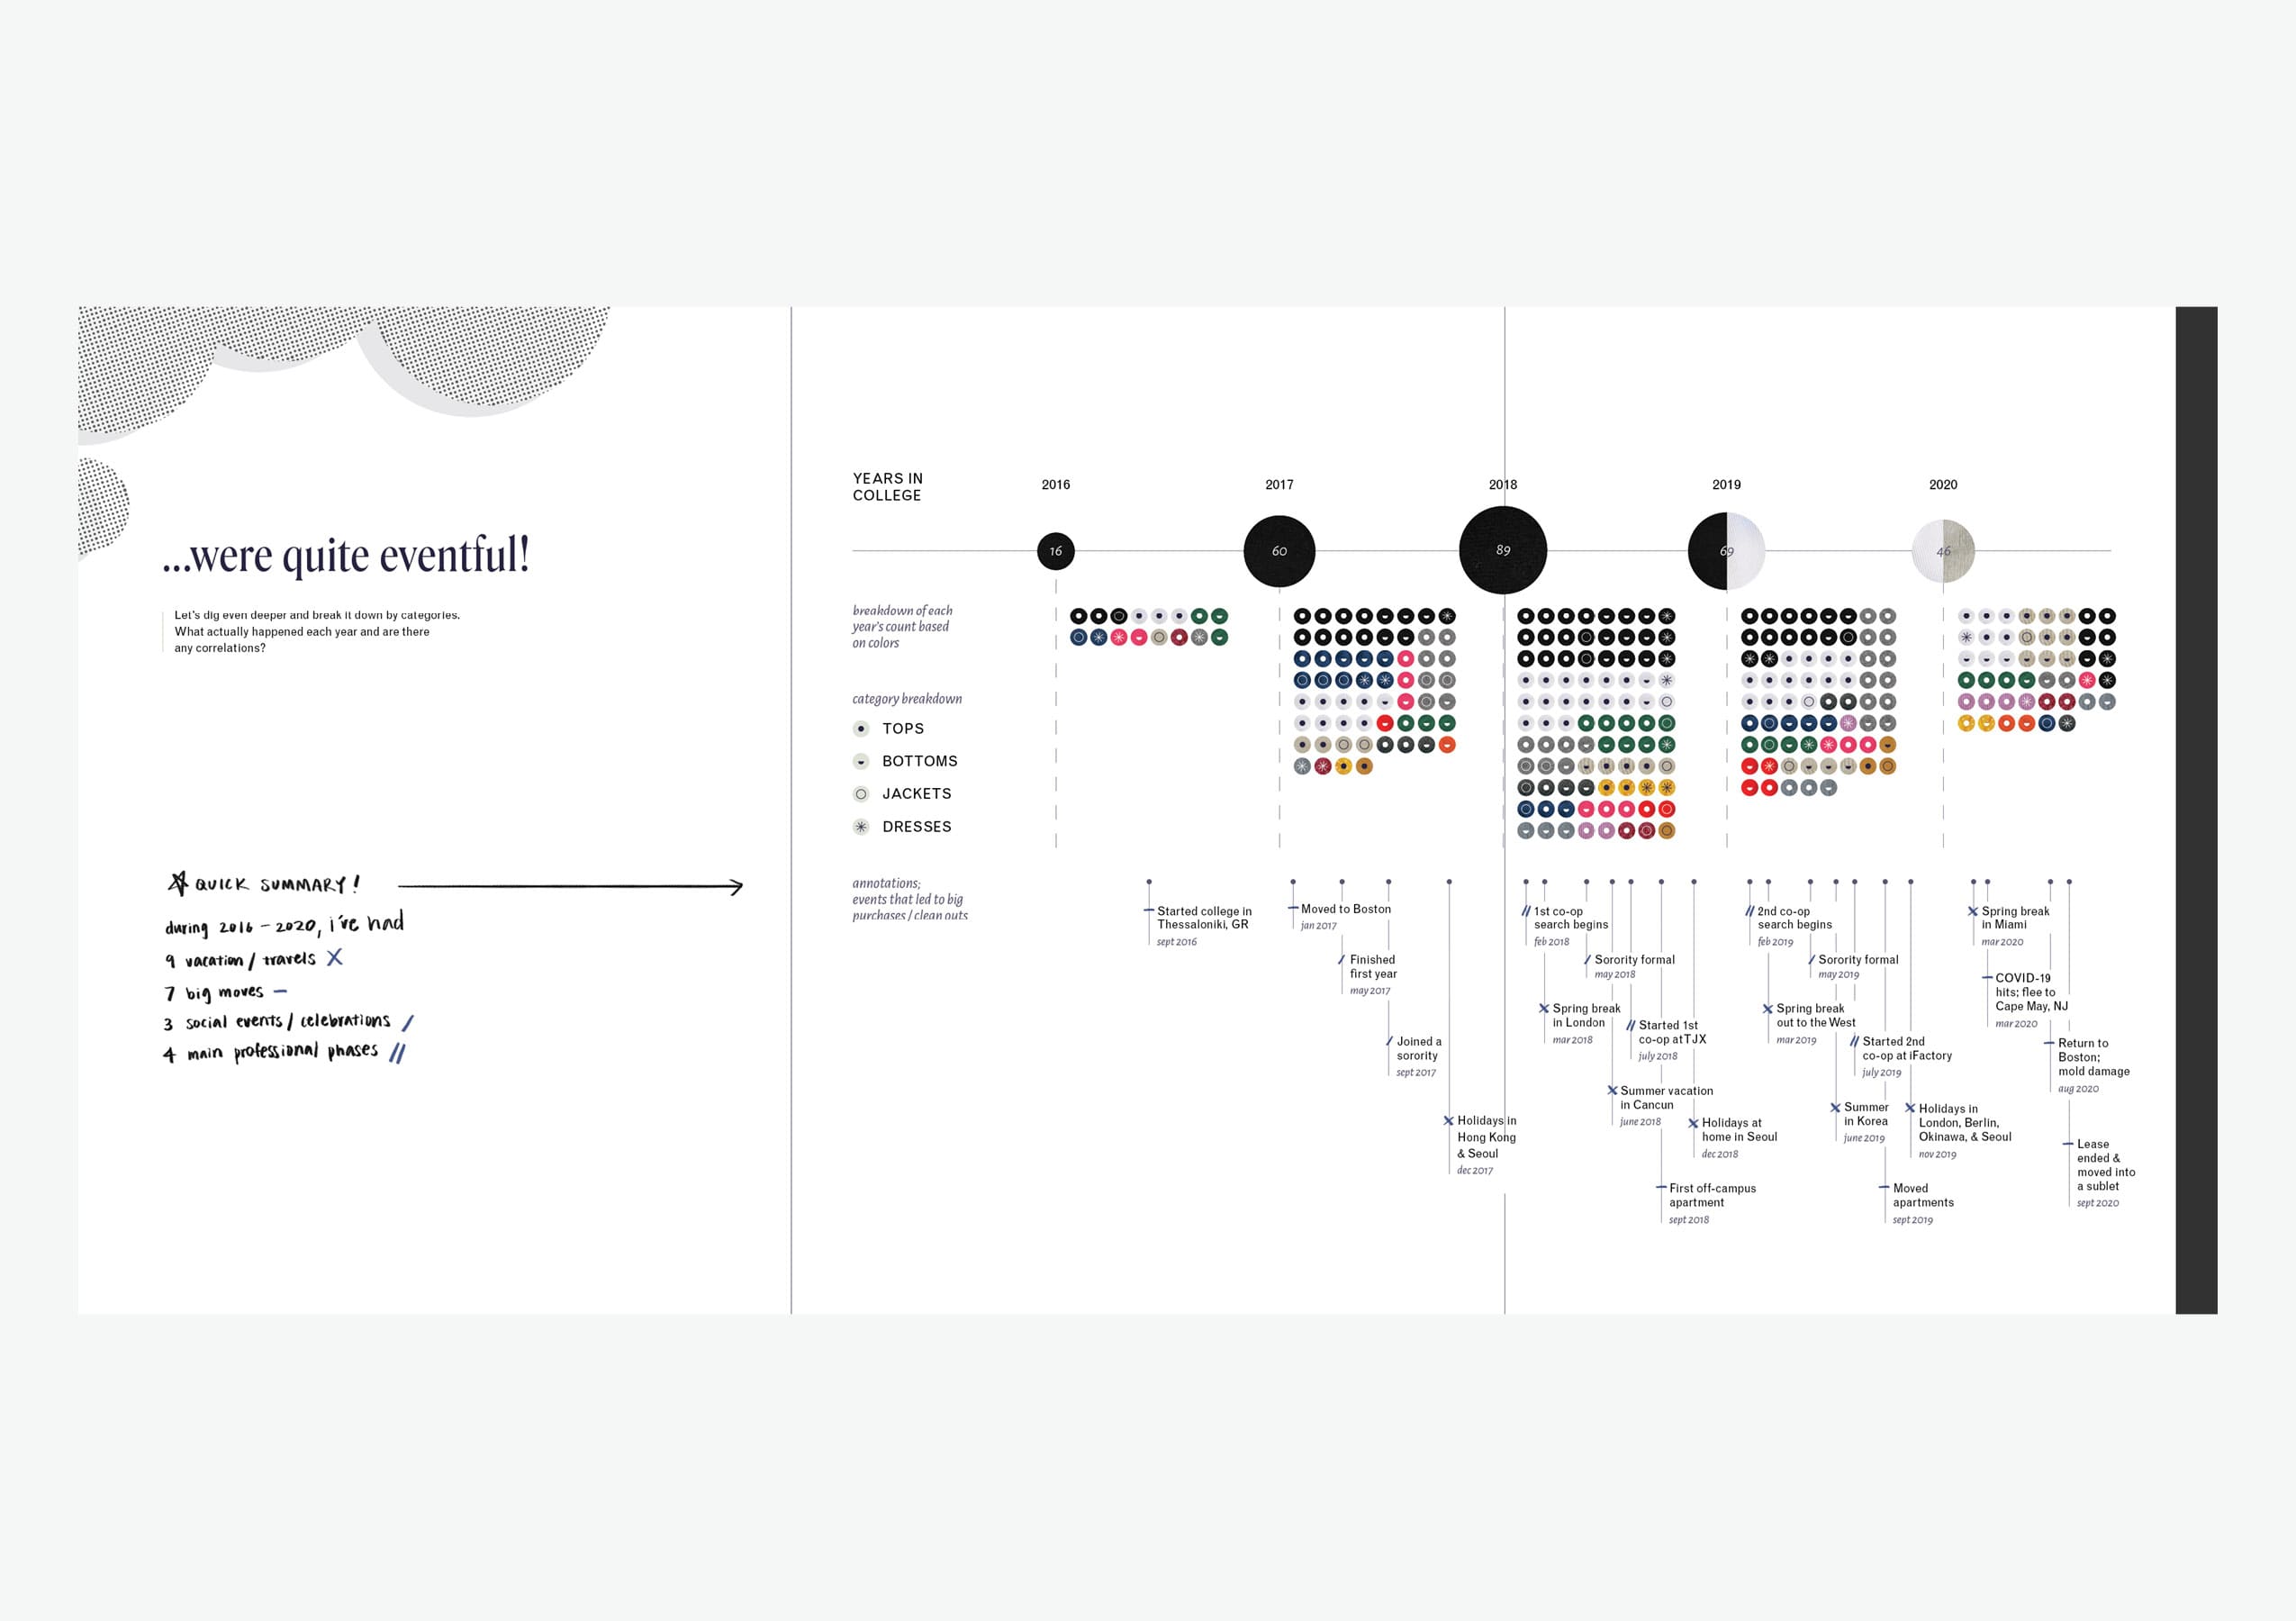
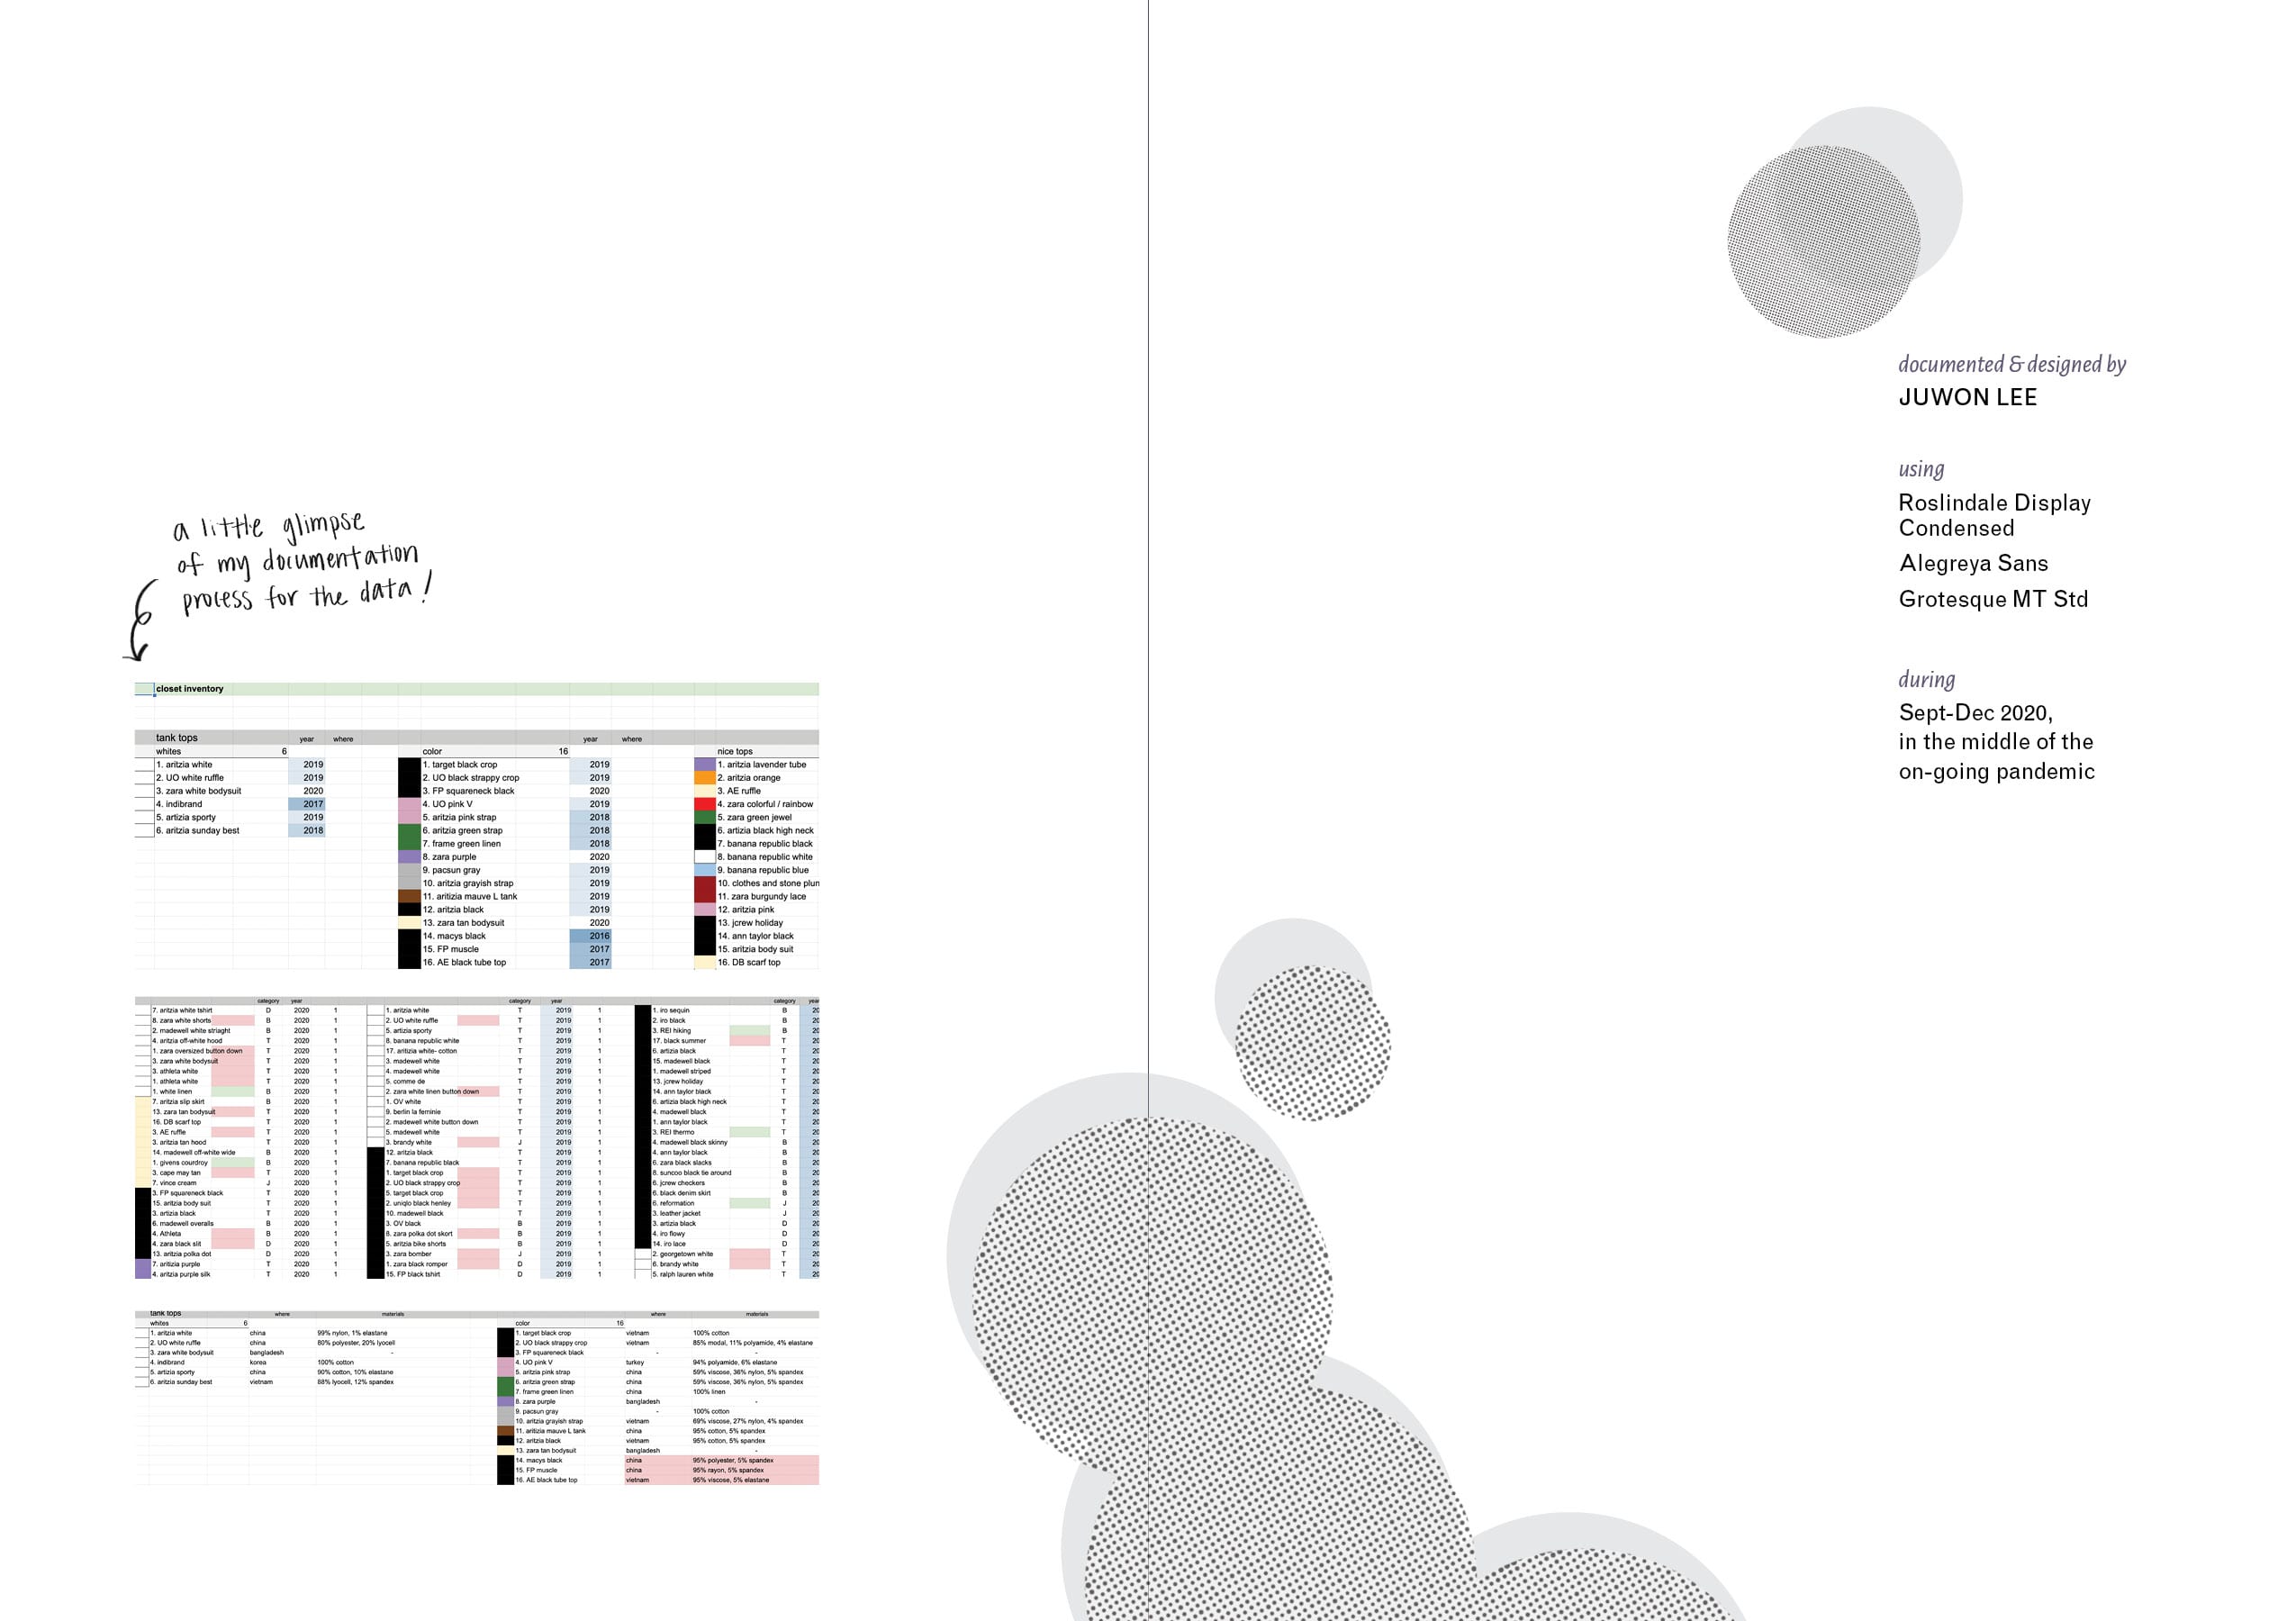
I took a detailed inventory of all of the items that I owned (which consisted of reorganizing my closet numerous times) and collected data in various categories, such as color, material, brand, year of purchase, type, and so on. Then I connected those items with my personal memories and events to tell my personal narrative.
Data Collection Process
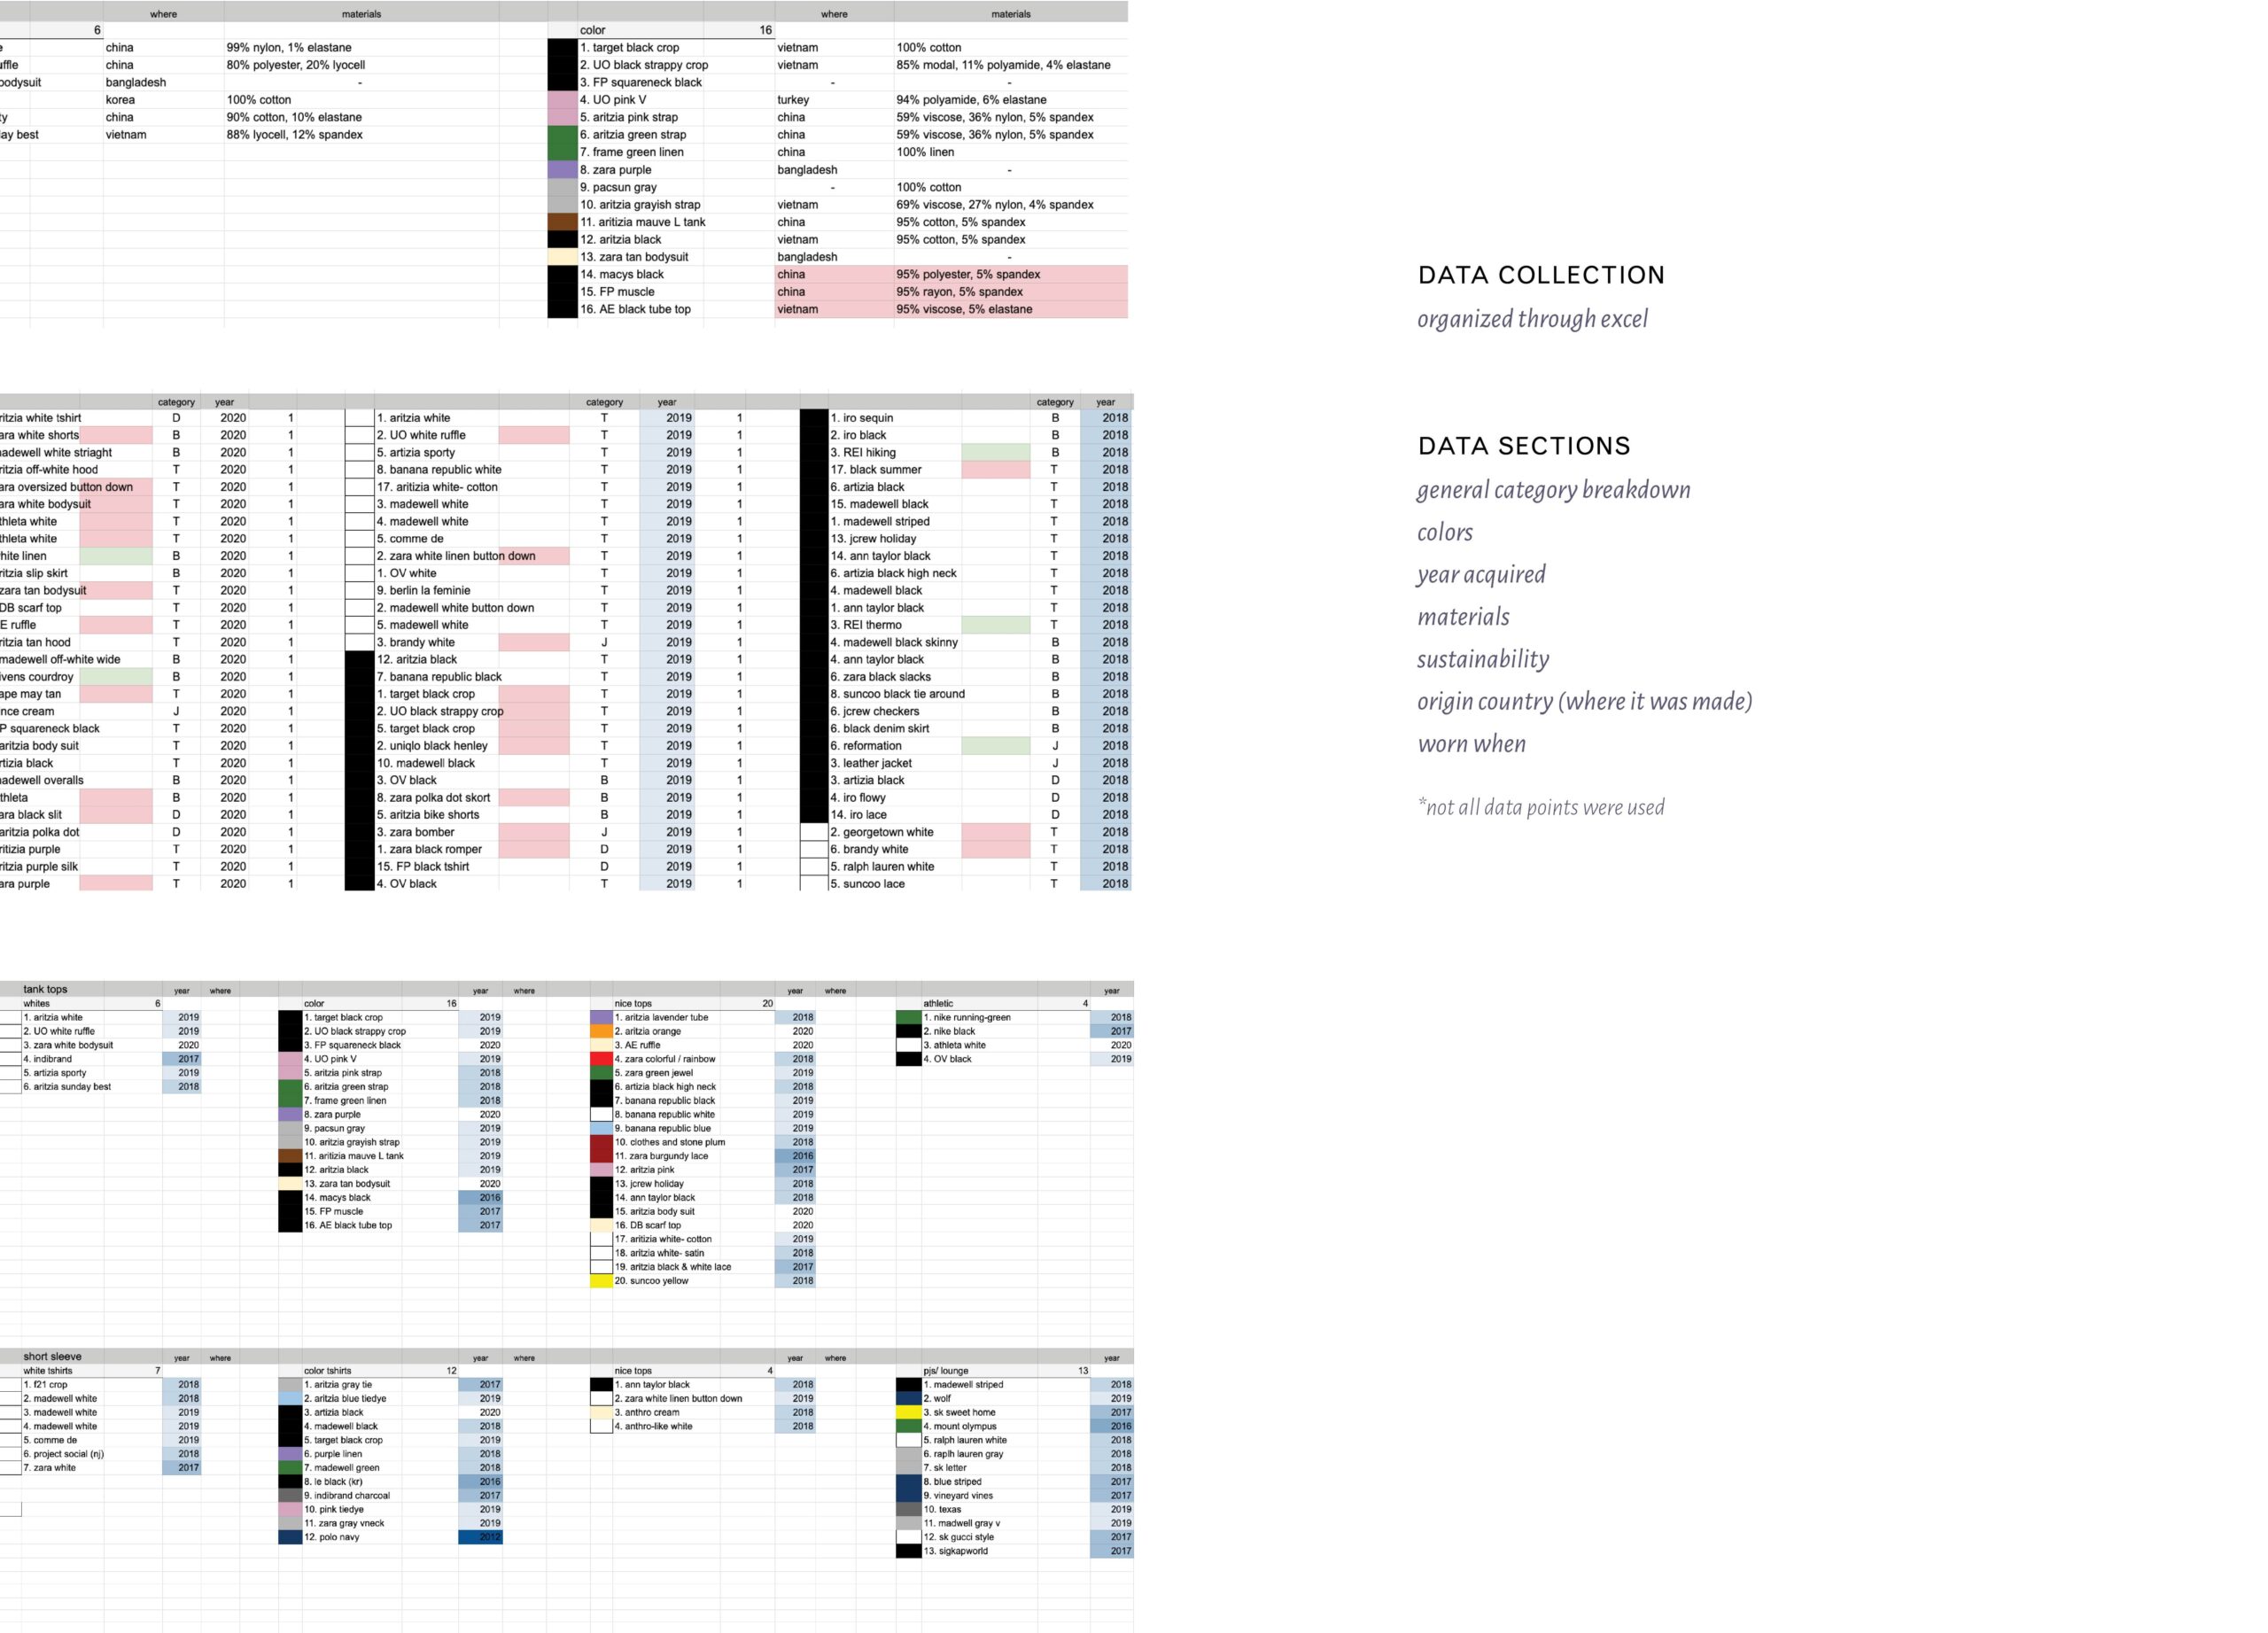
Initial + Final Process
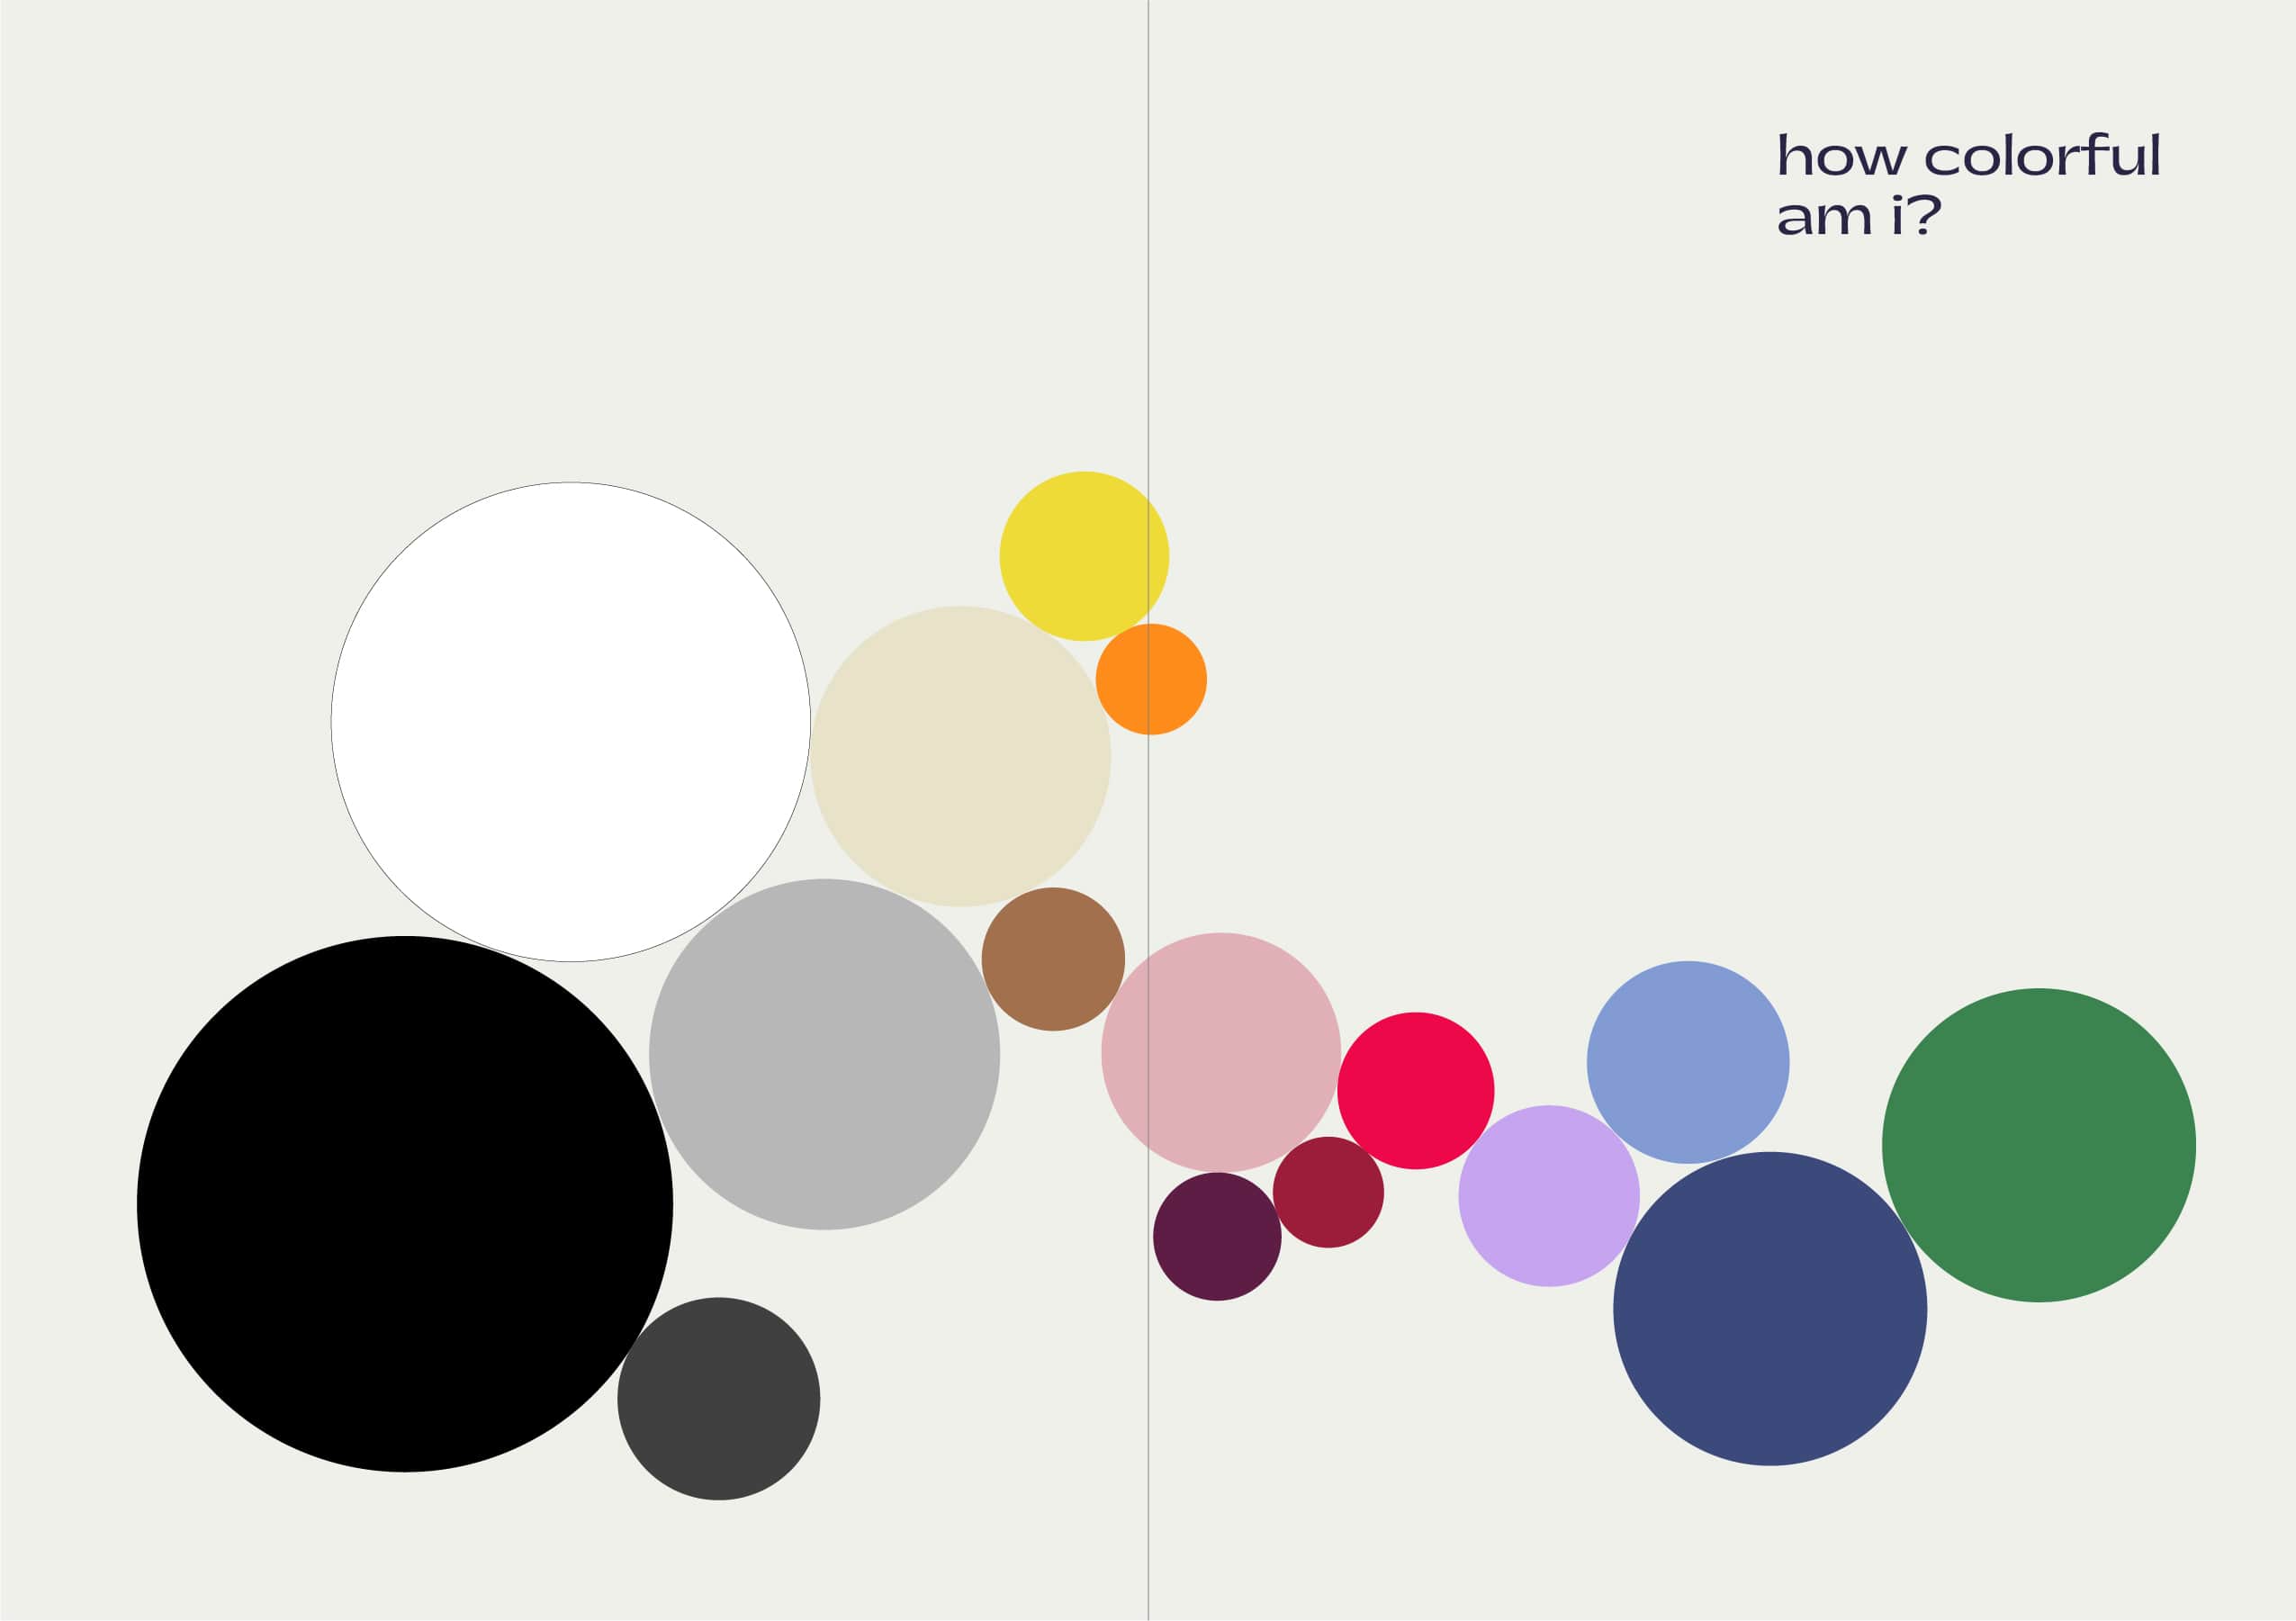
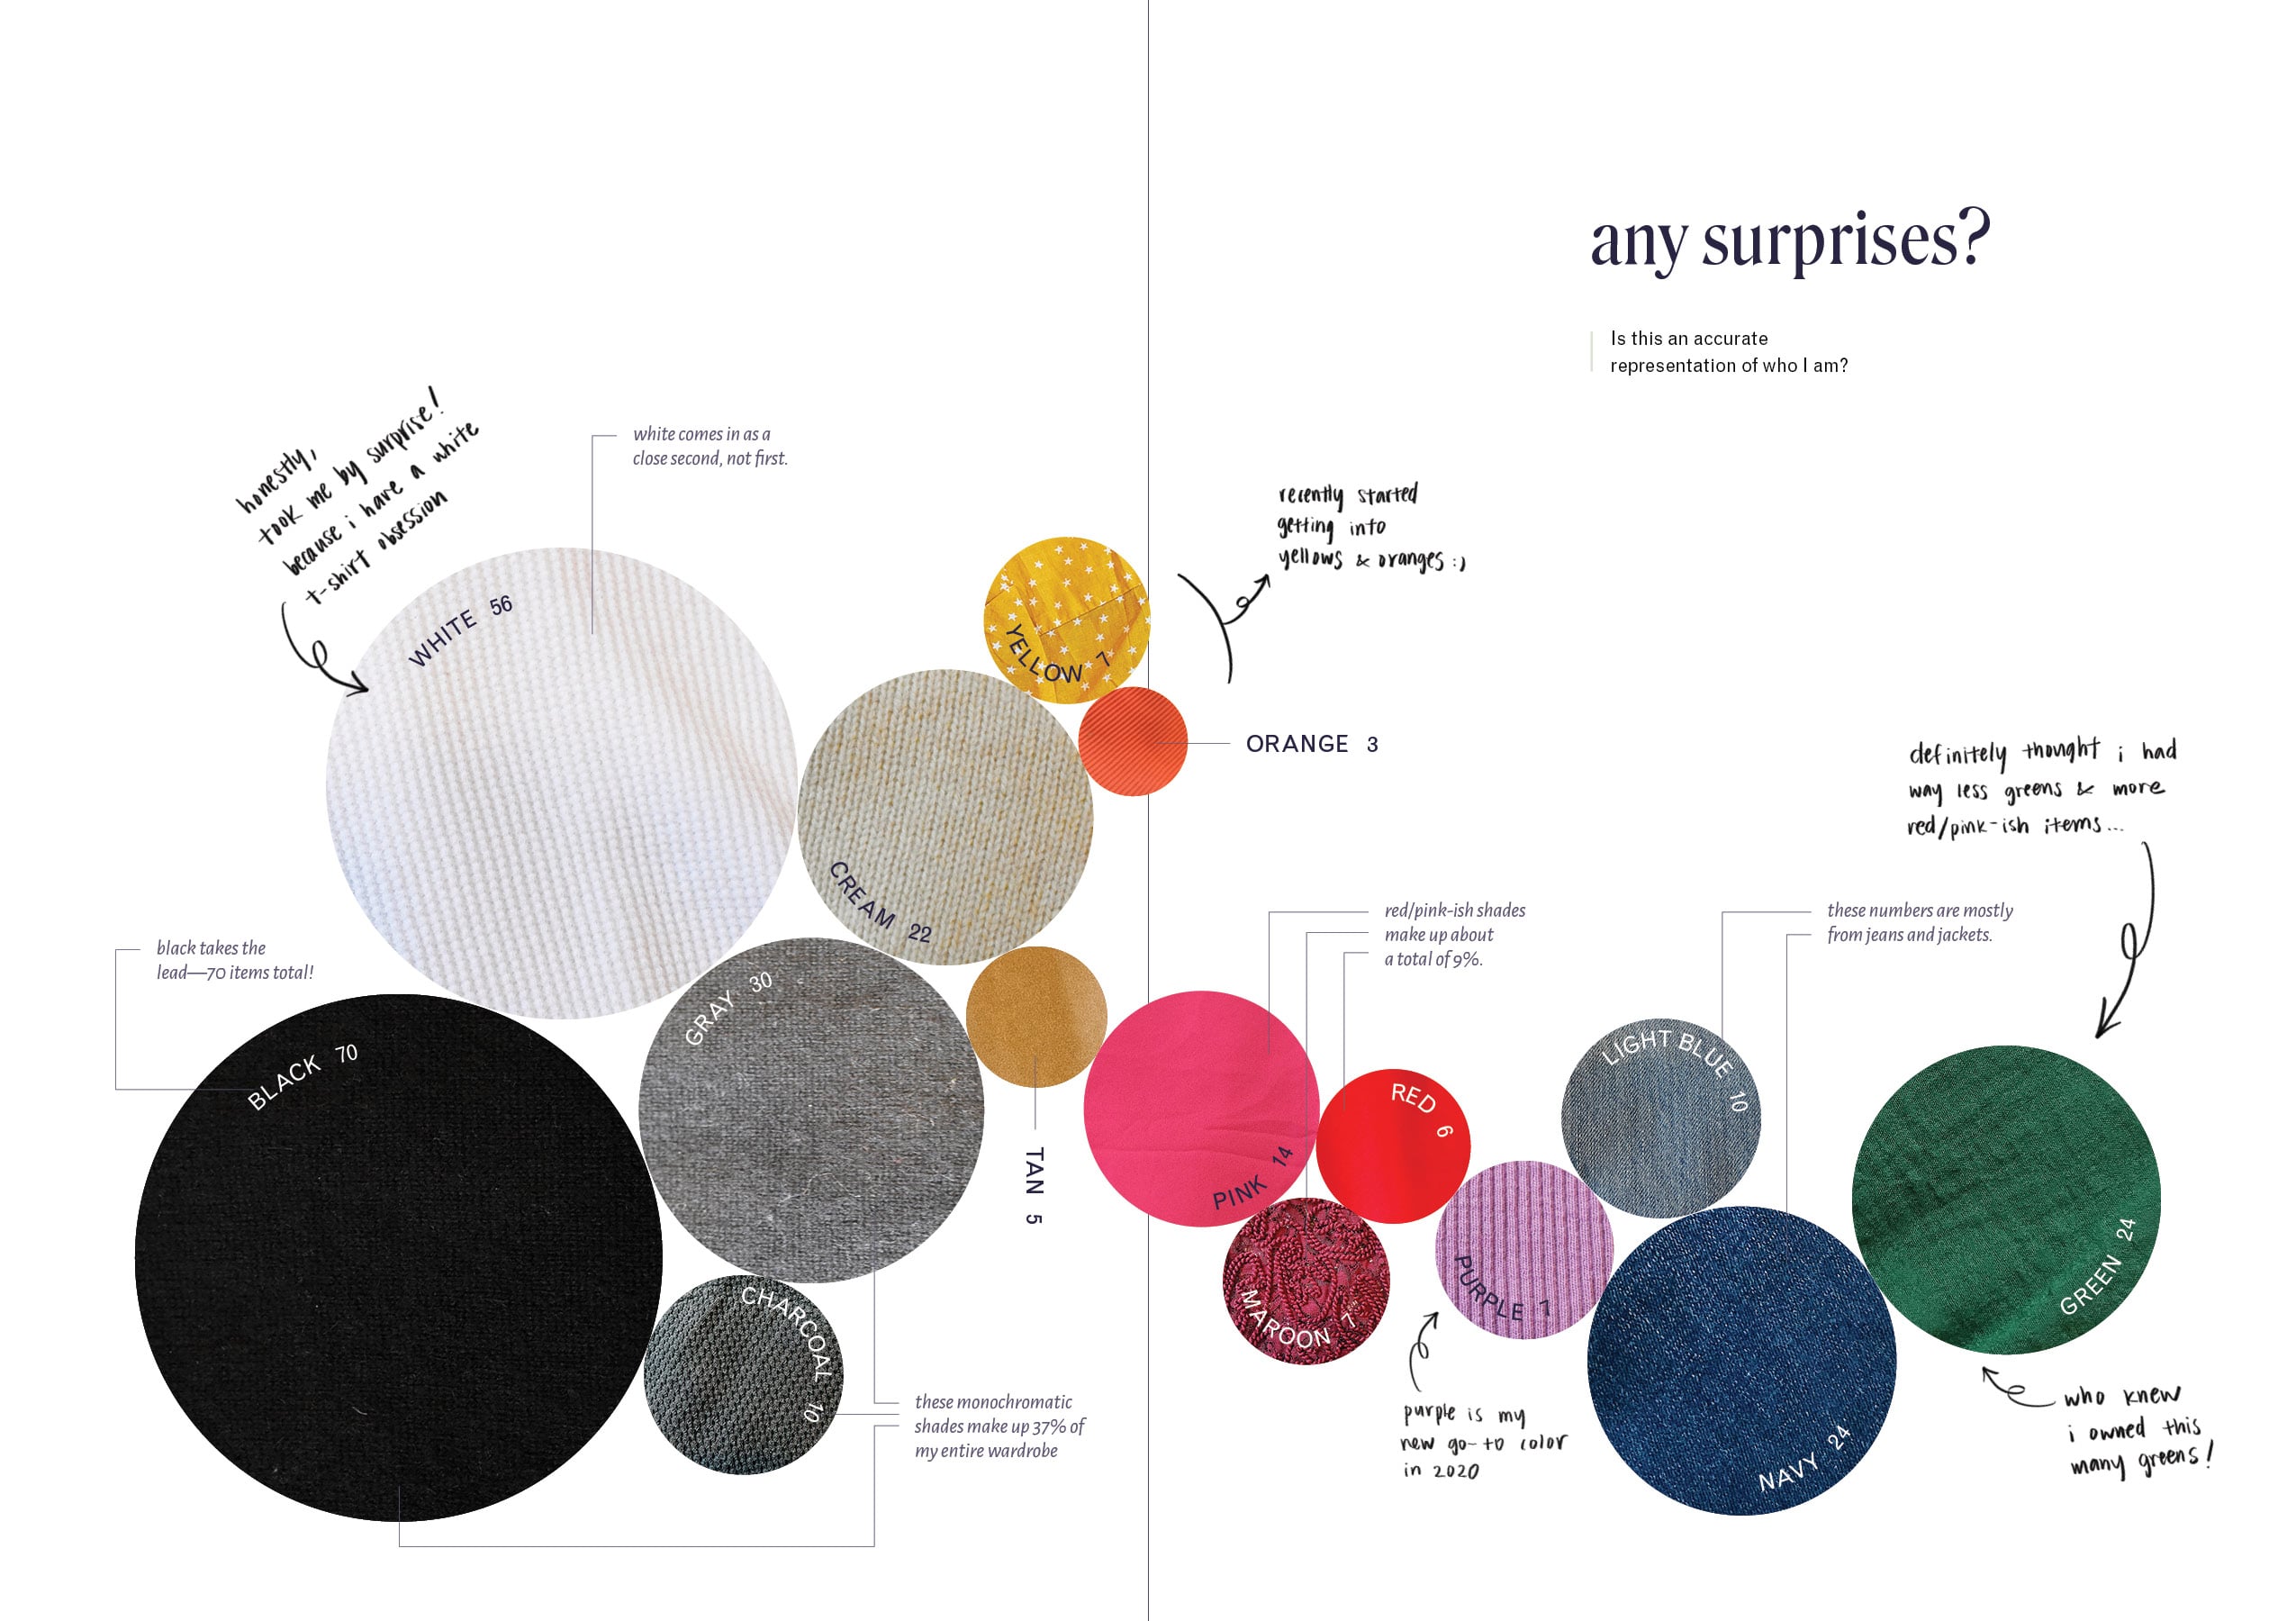
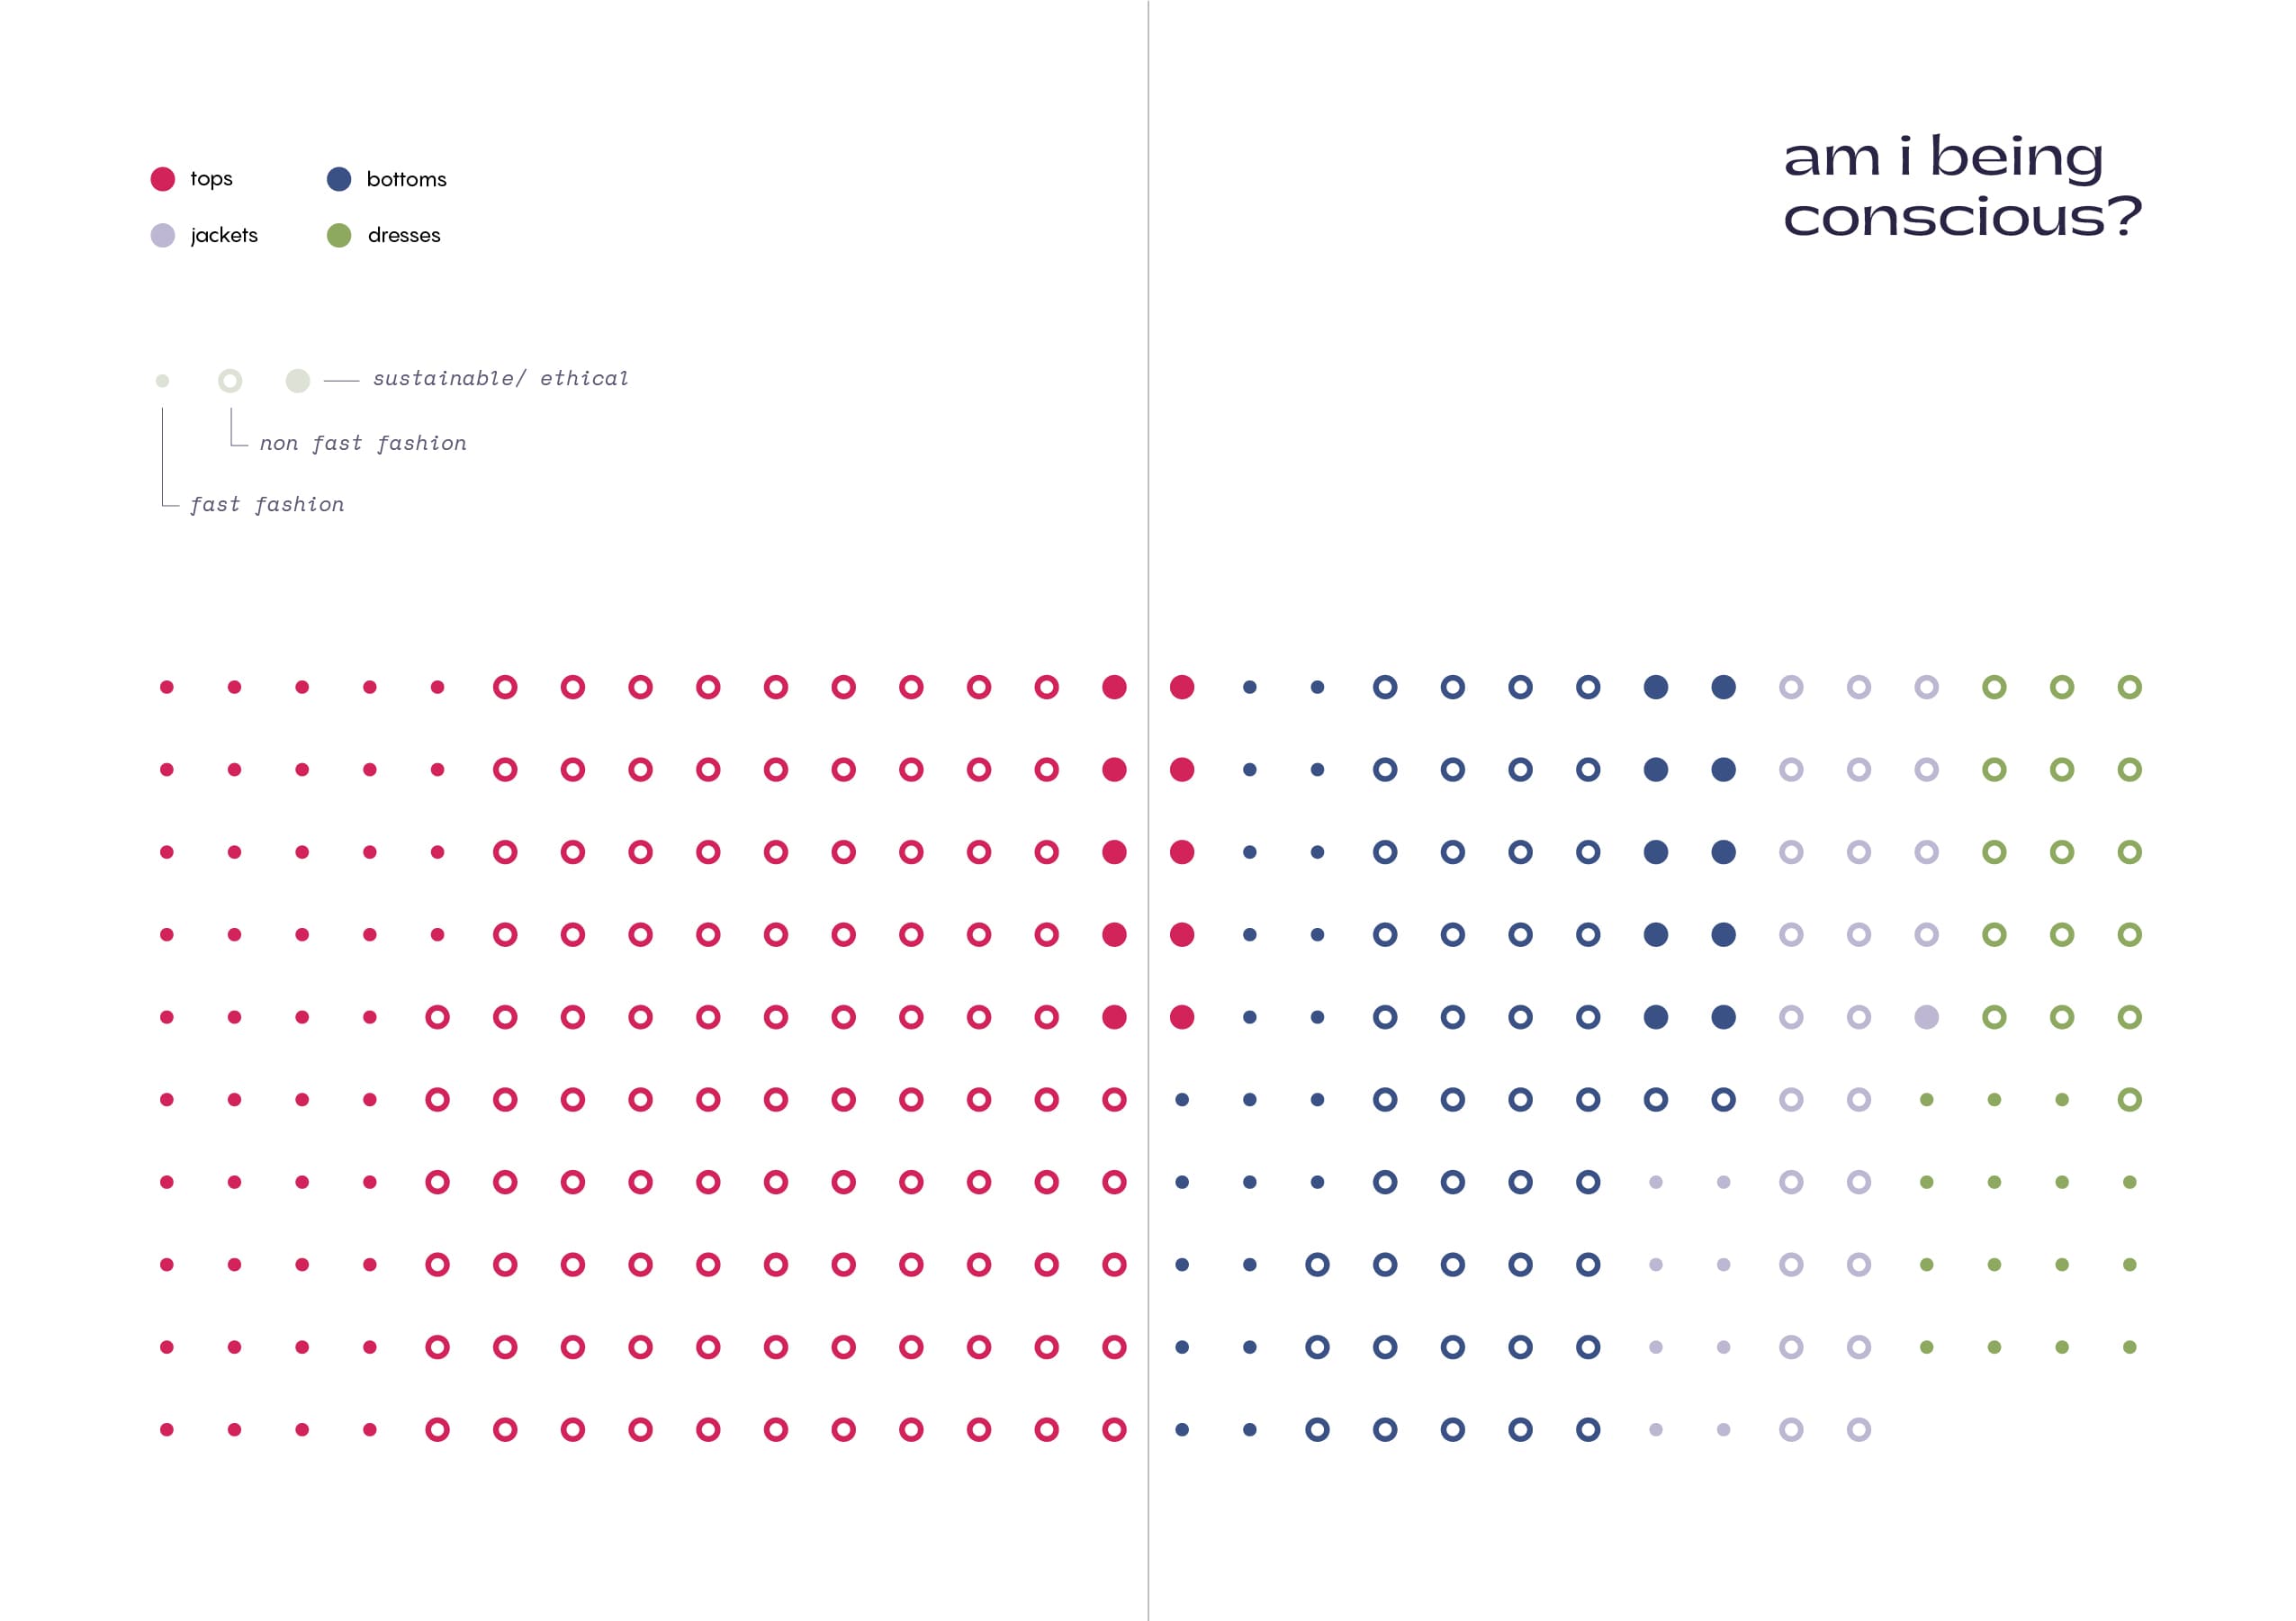
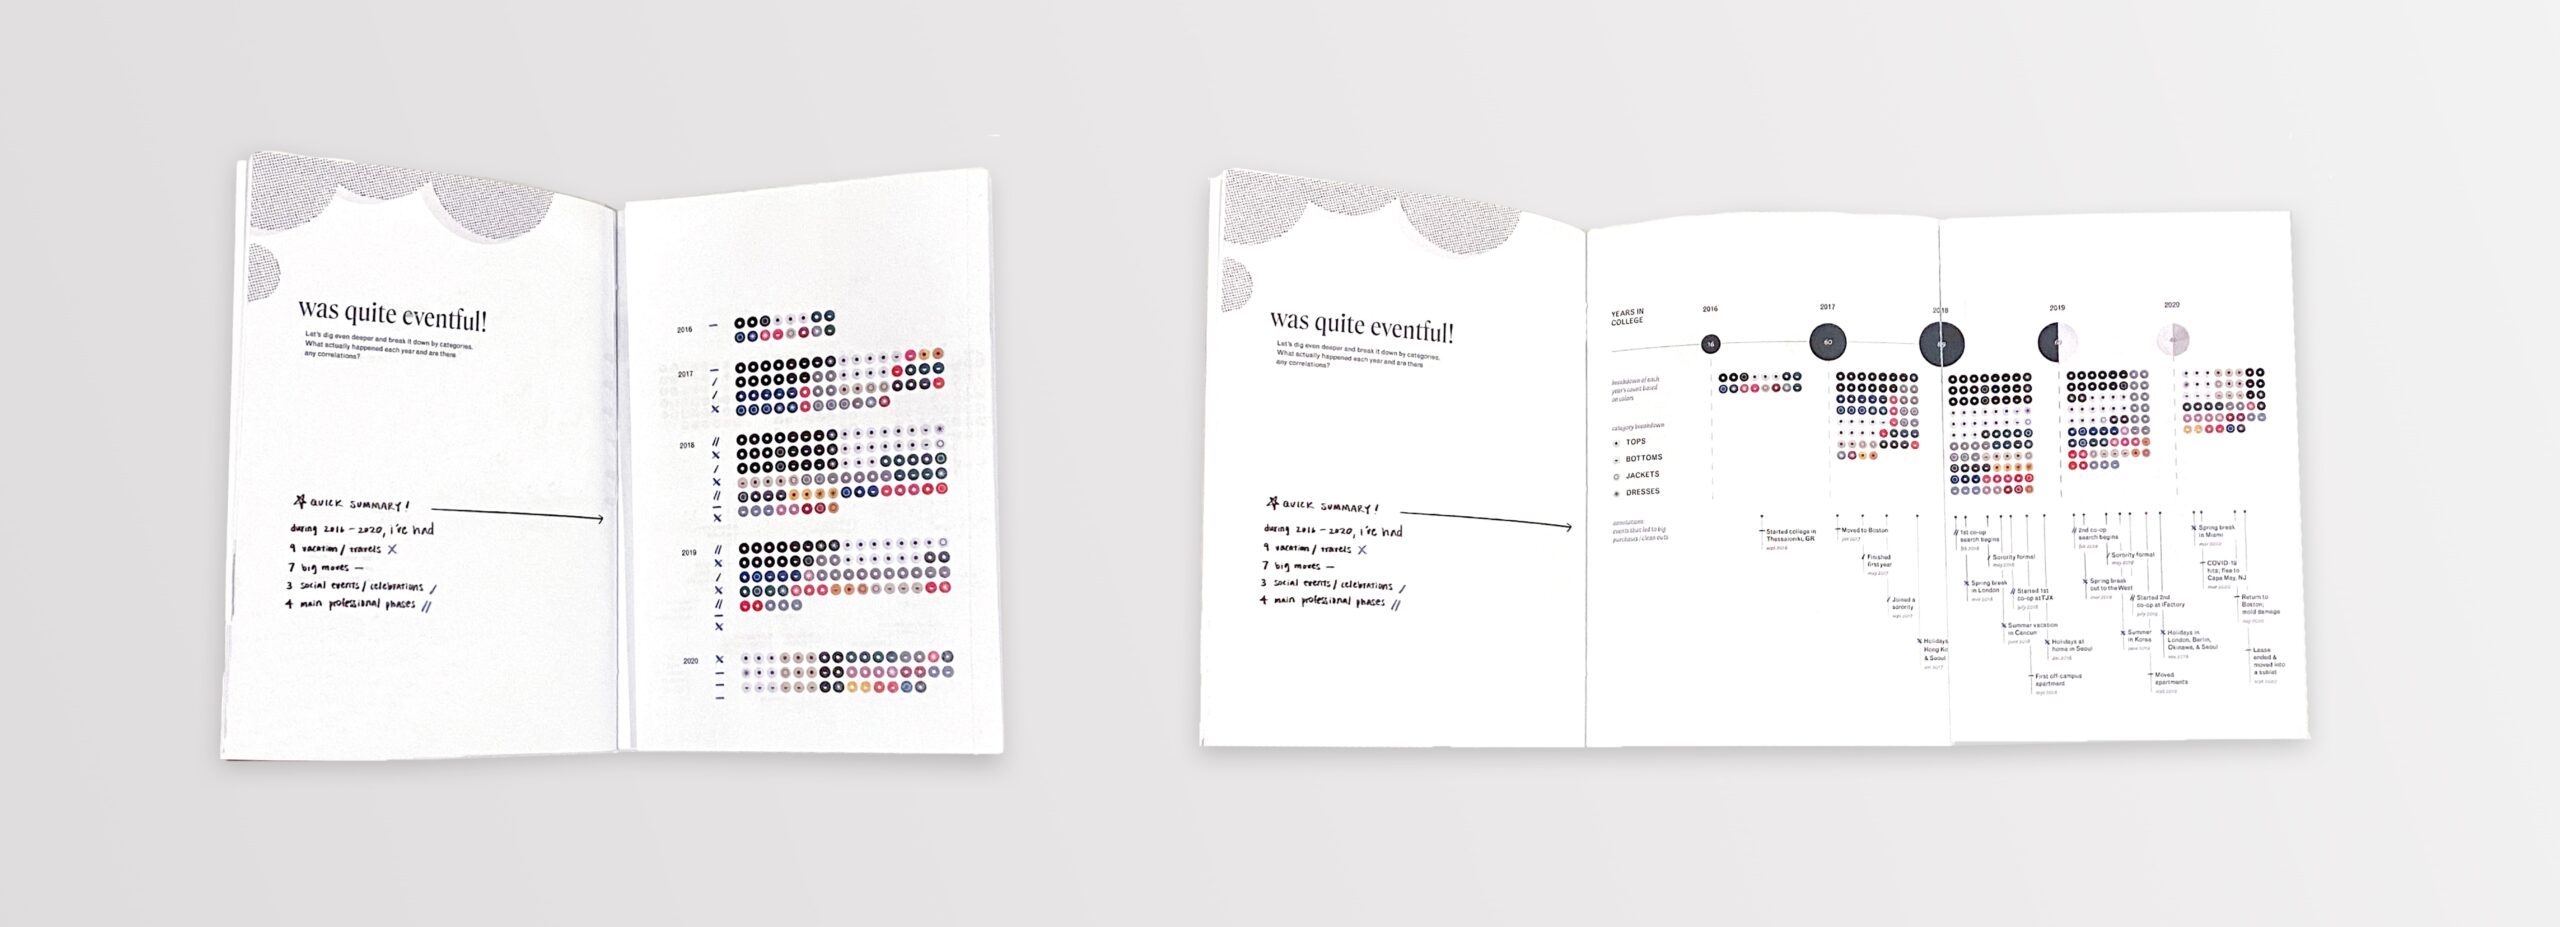
Final Product
The final booklet came out to be about 4.25" x 6". I chose a saddle stitch binding method with white thread to continue on with the personal and humanistic approach. Check out the spreads below!


Project 1: Surroundings & Productivity
Spring 2020. Data visualization exploration for an exhibition concept.
Important Factors in Choosing a Workplace
Living in a garden-level apartment with no adequate exposure to natural light really gave me a new level of appreciation for light. During that year, I quite often found myself seeking out other places to get work done—especially during the winter months in Boston. After talking to a handful of friends around me who shared similar experiences, I wanted to create an experience design & data visualization project that focused on the importance of light and its correlation to productivity.
As a full-time student at the time, I started by asking myself this set of questions:
- What surrounding factors do students prioritize to maximize productivity?
- What is the most important thing you look for when choosing a workspace?
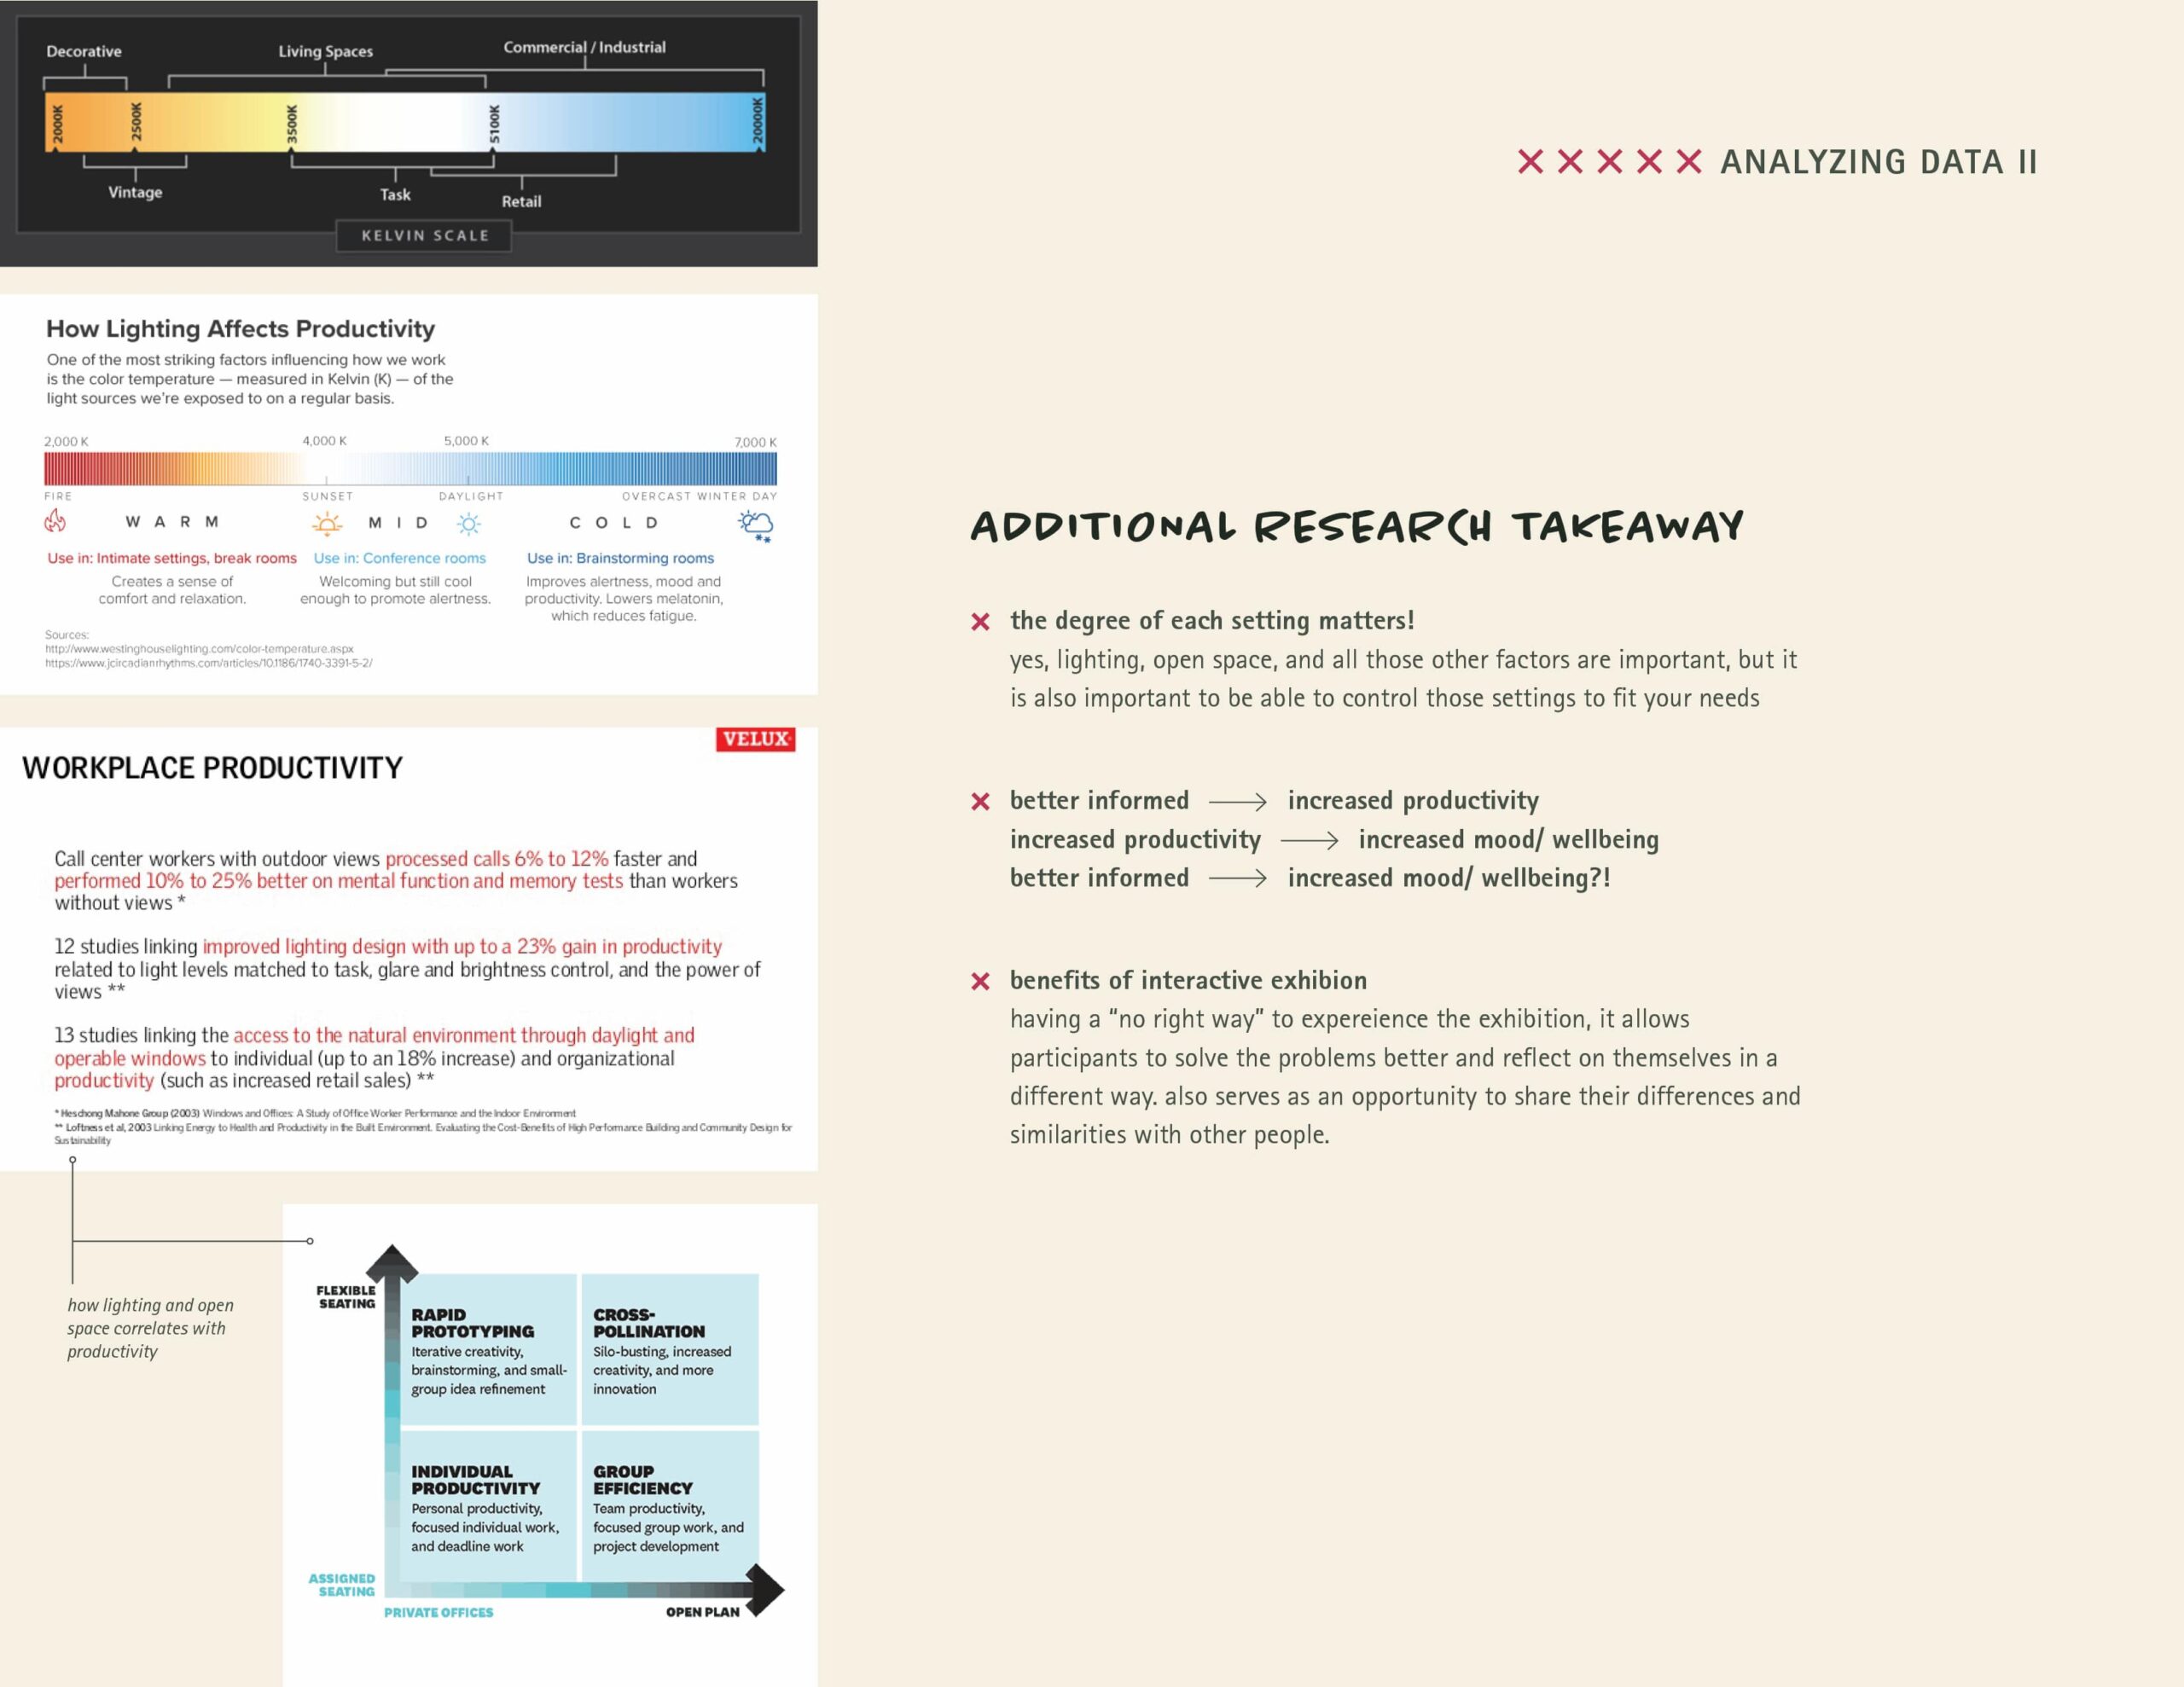
- How much does lighting come into play?
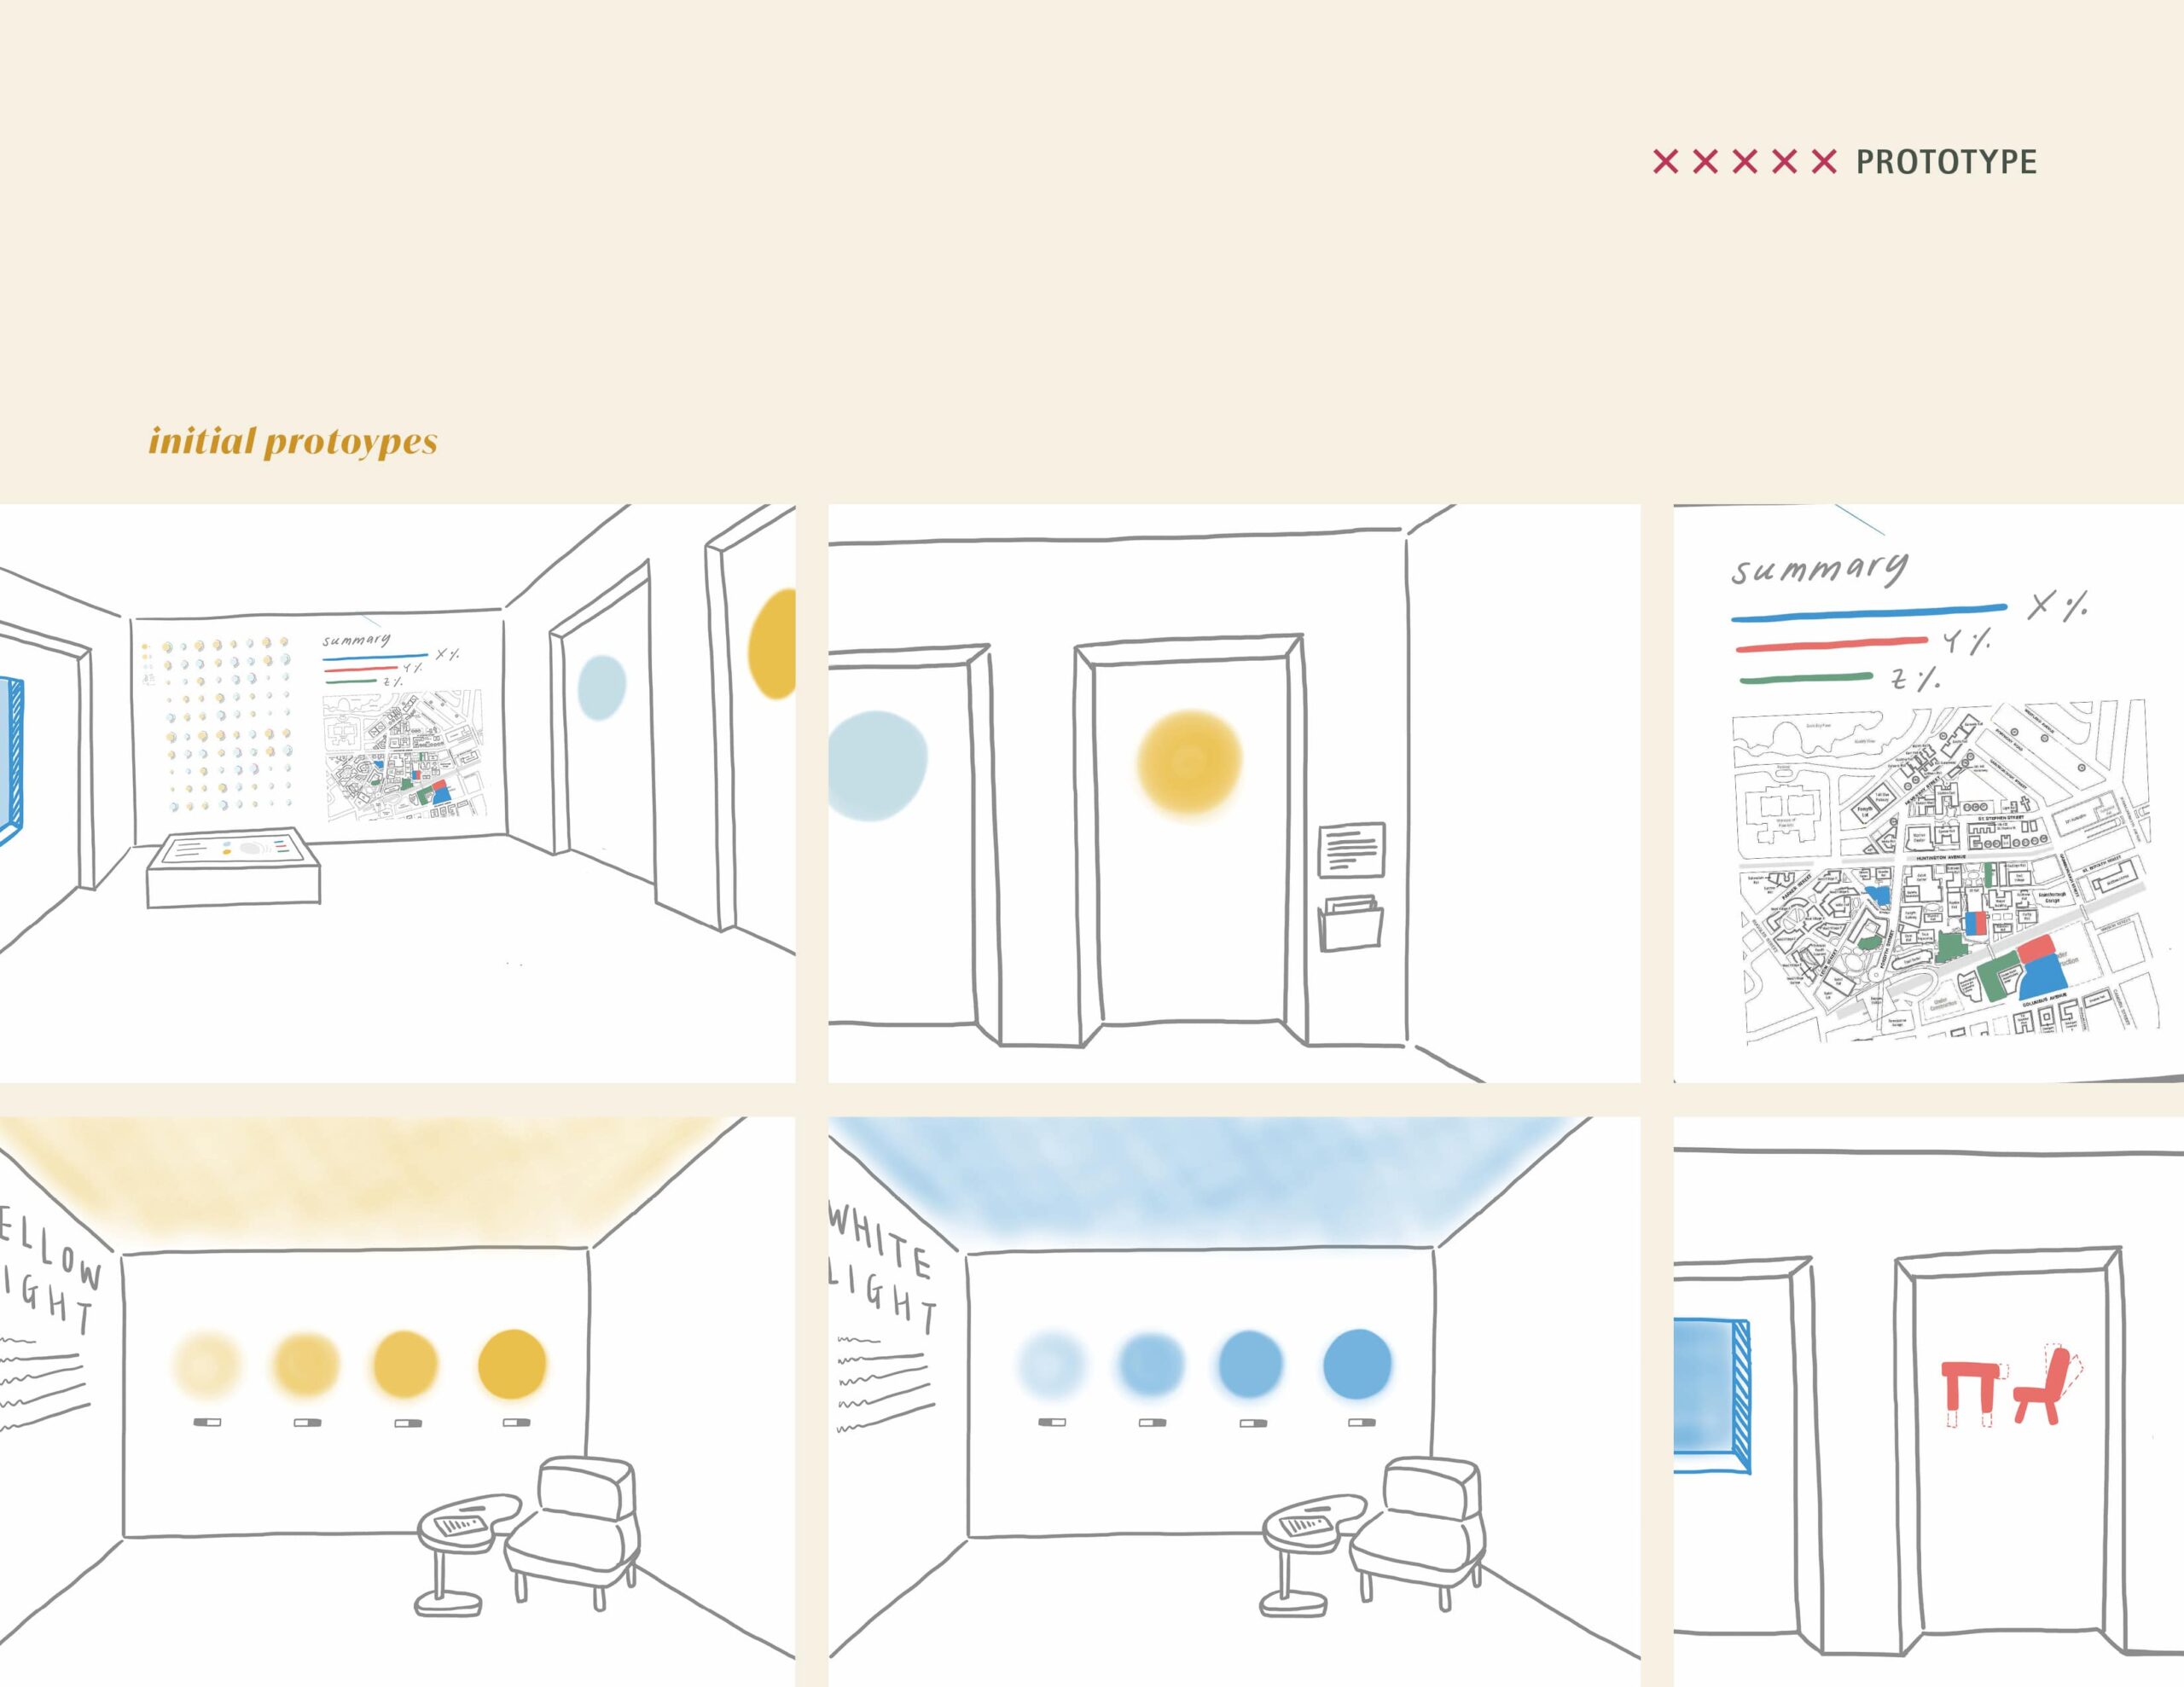
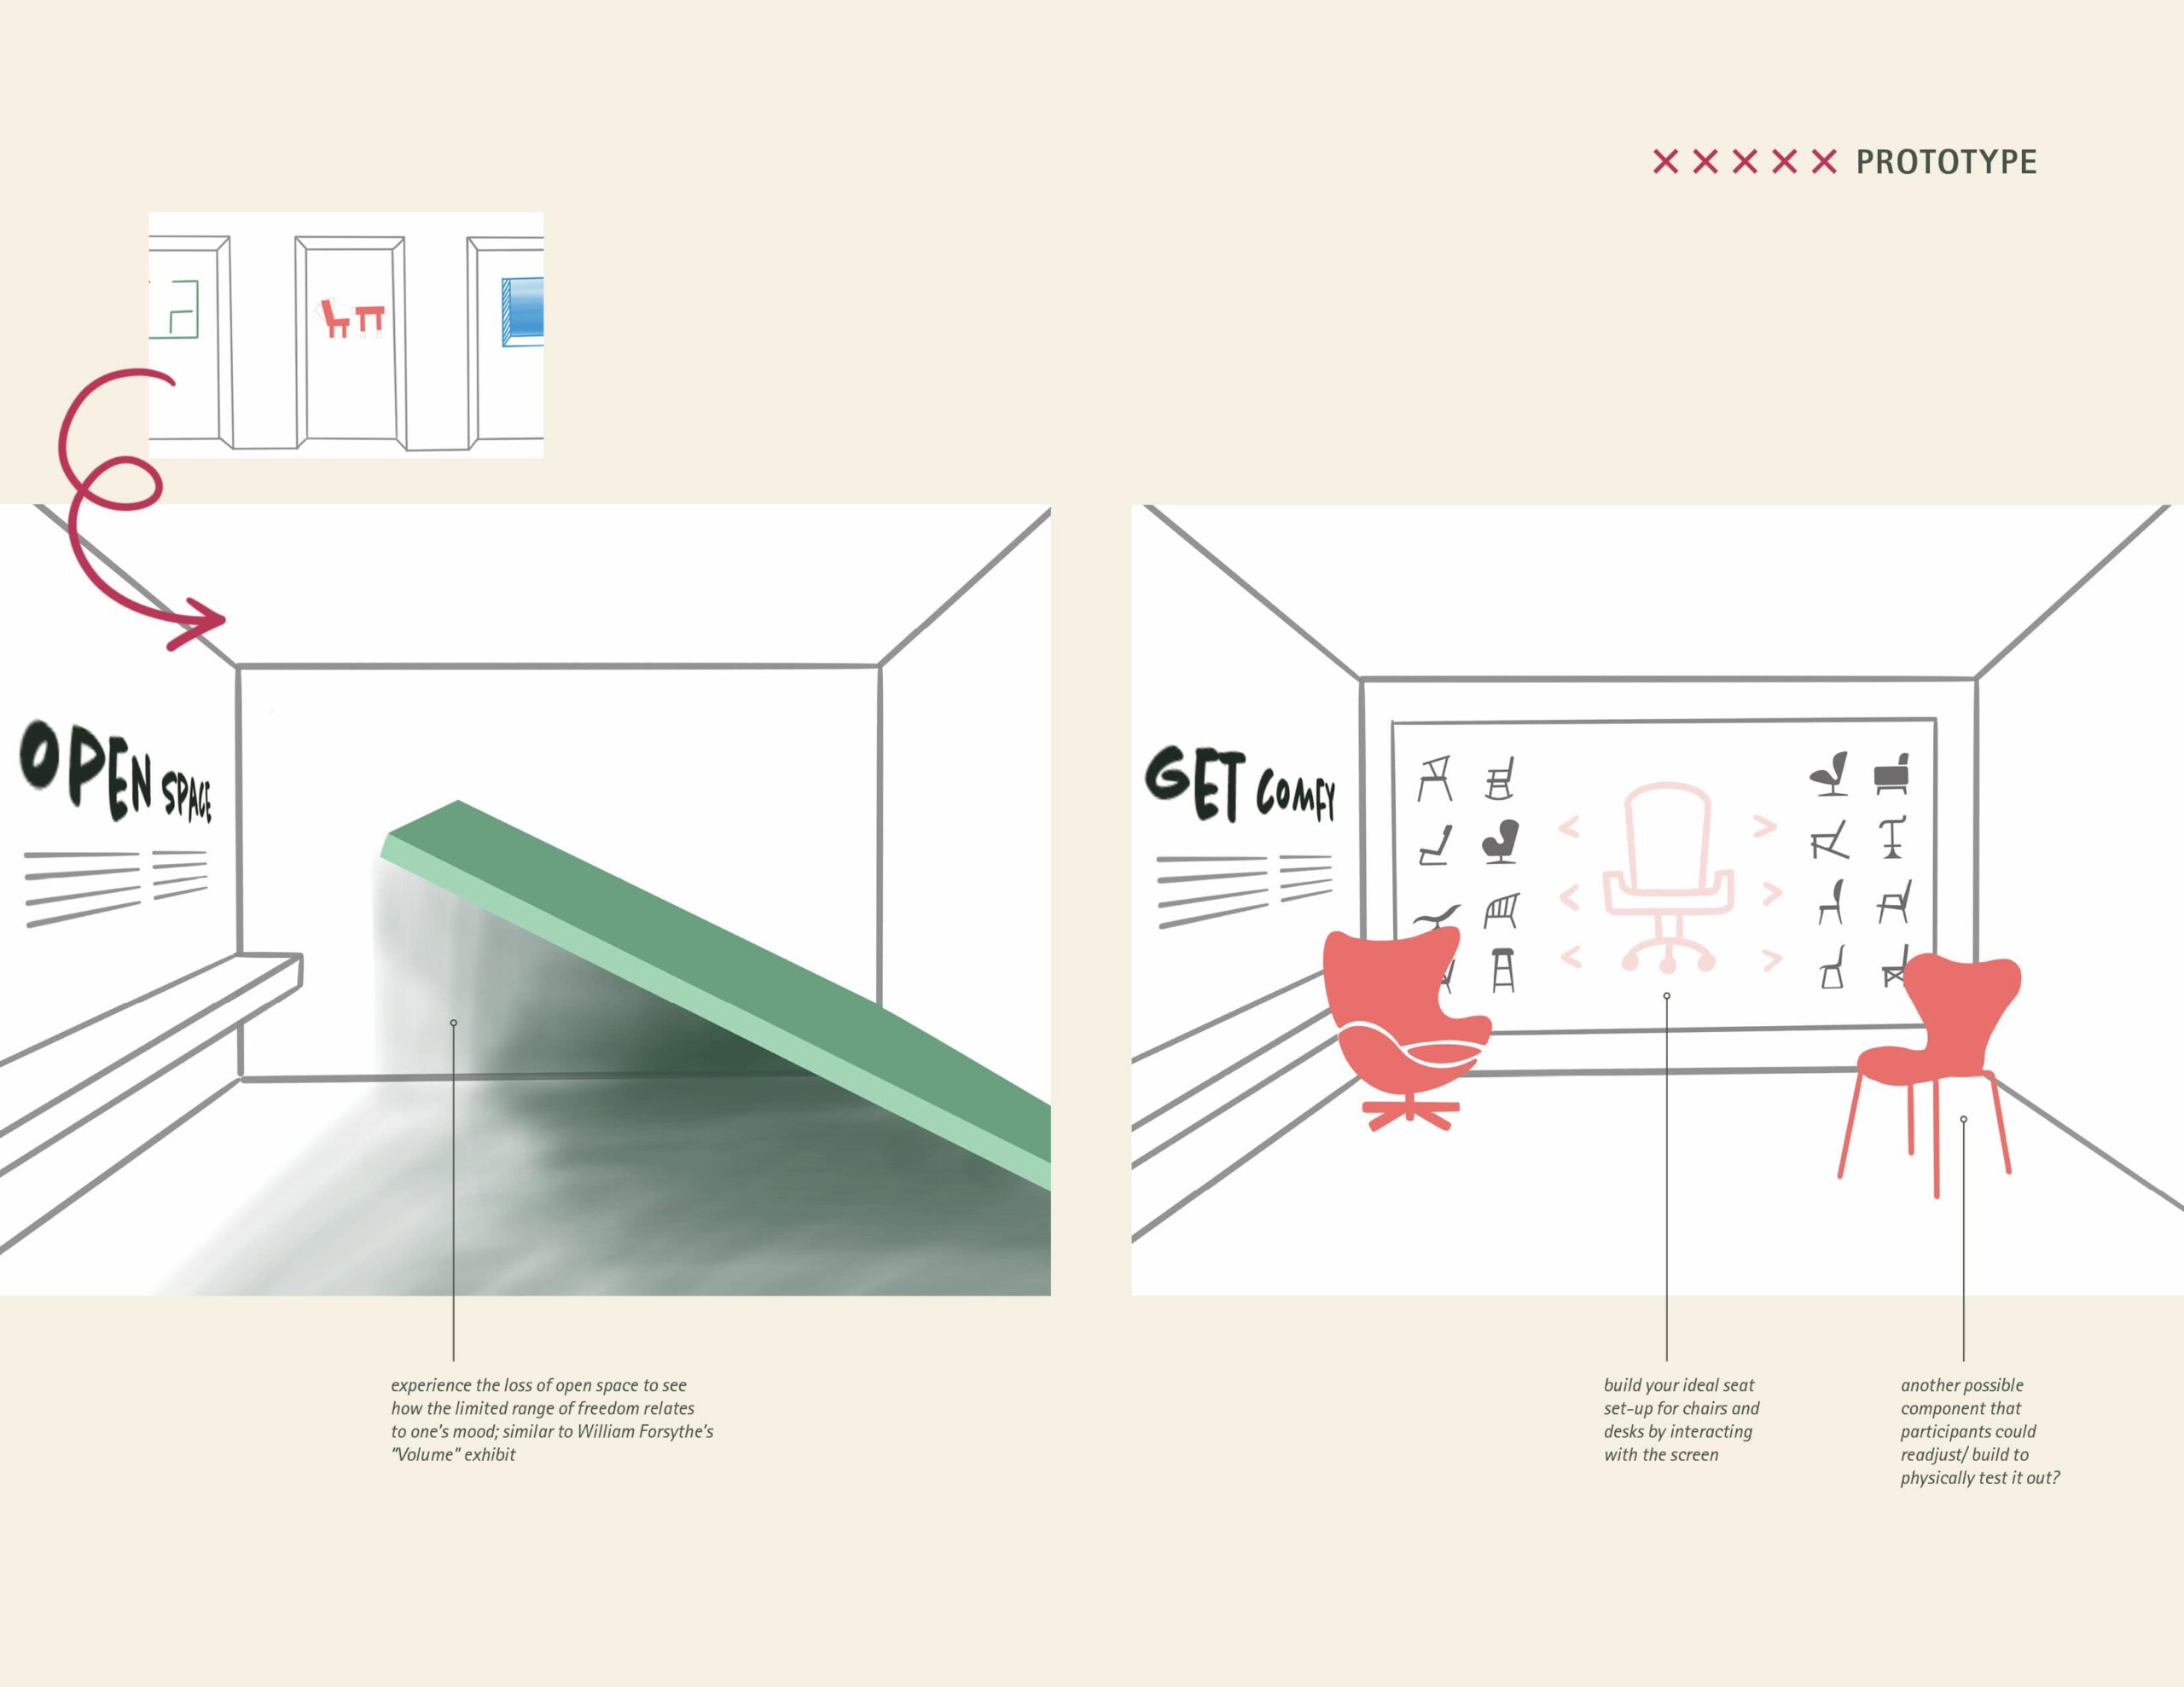
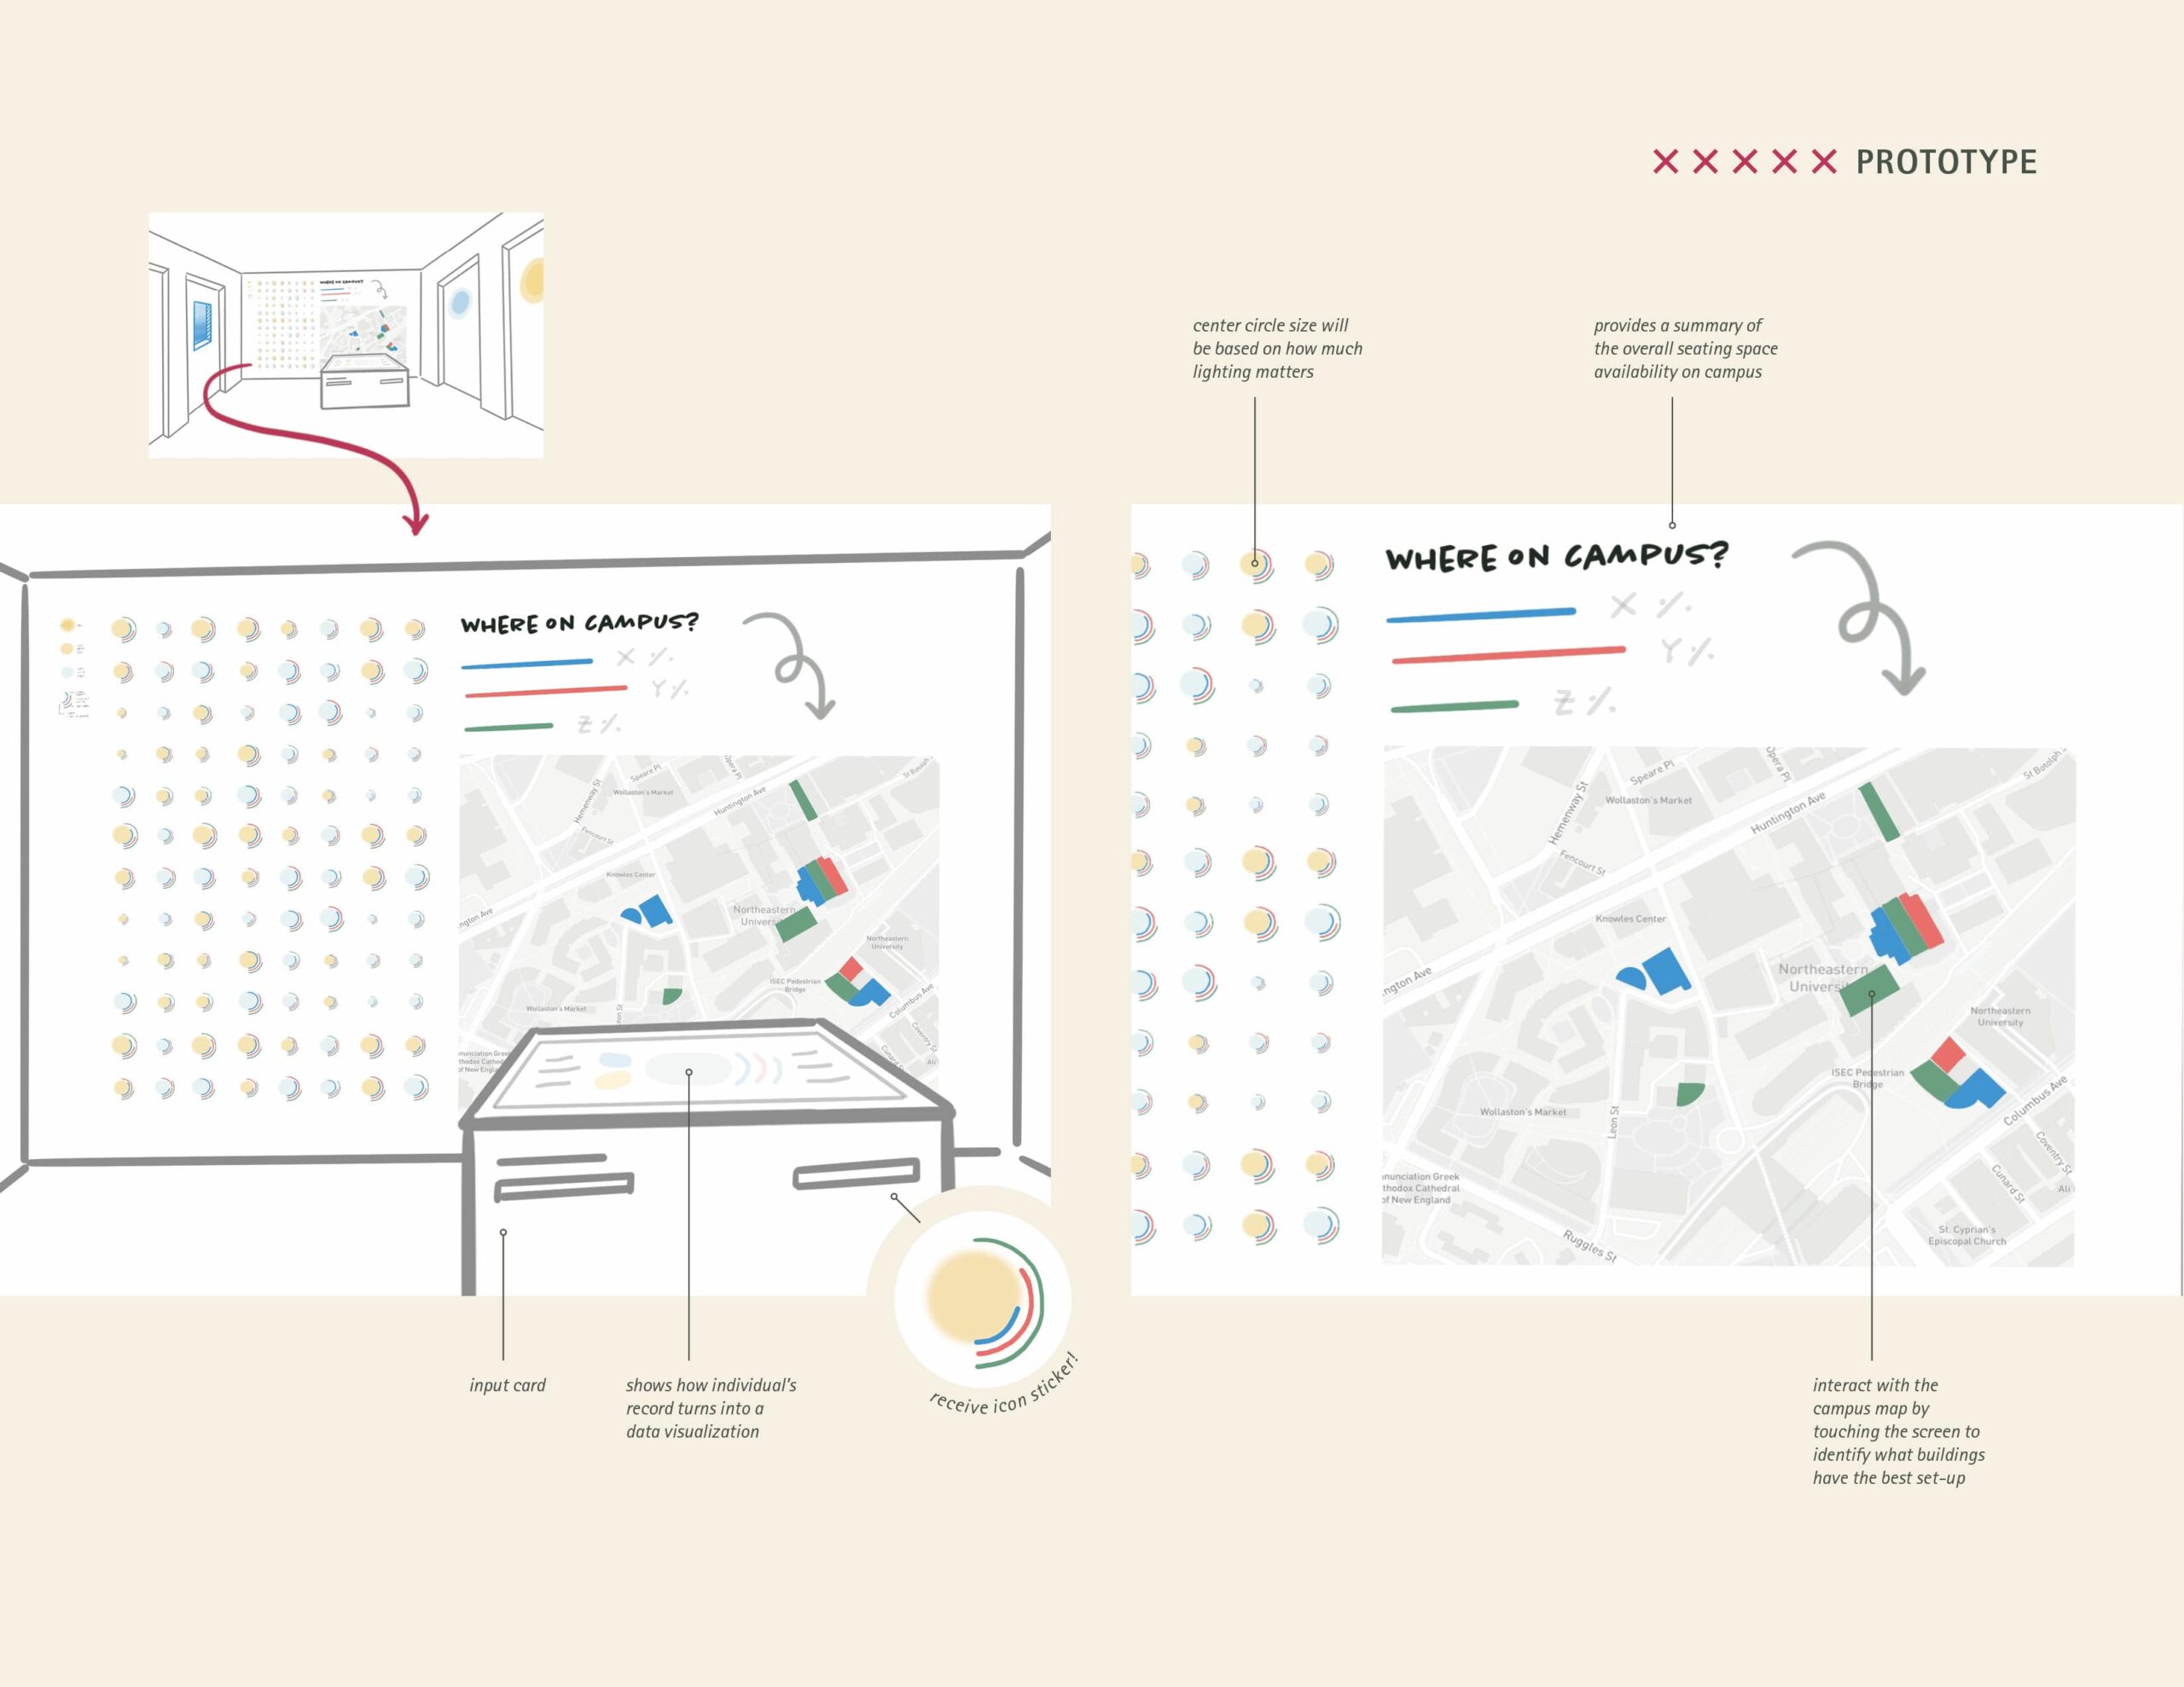
Exhibition Concept Prototype
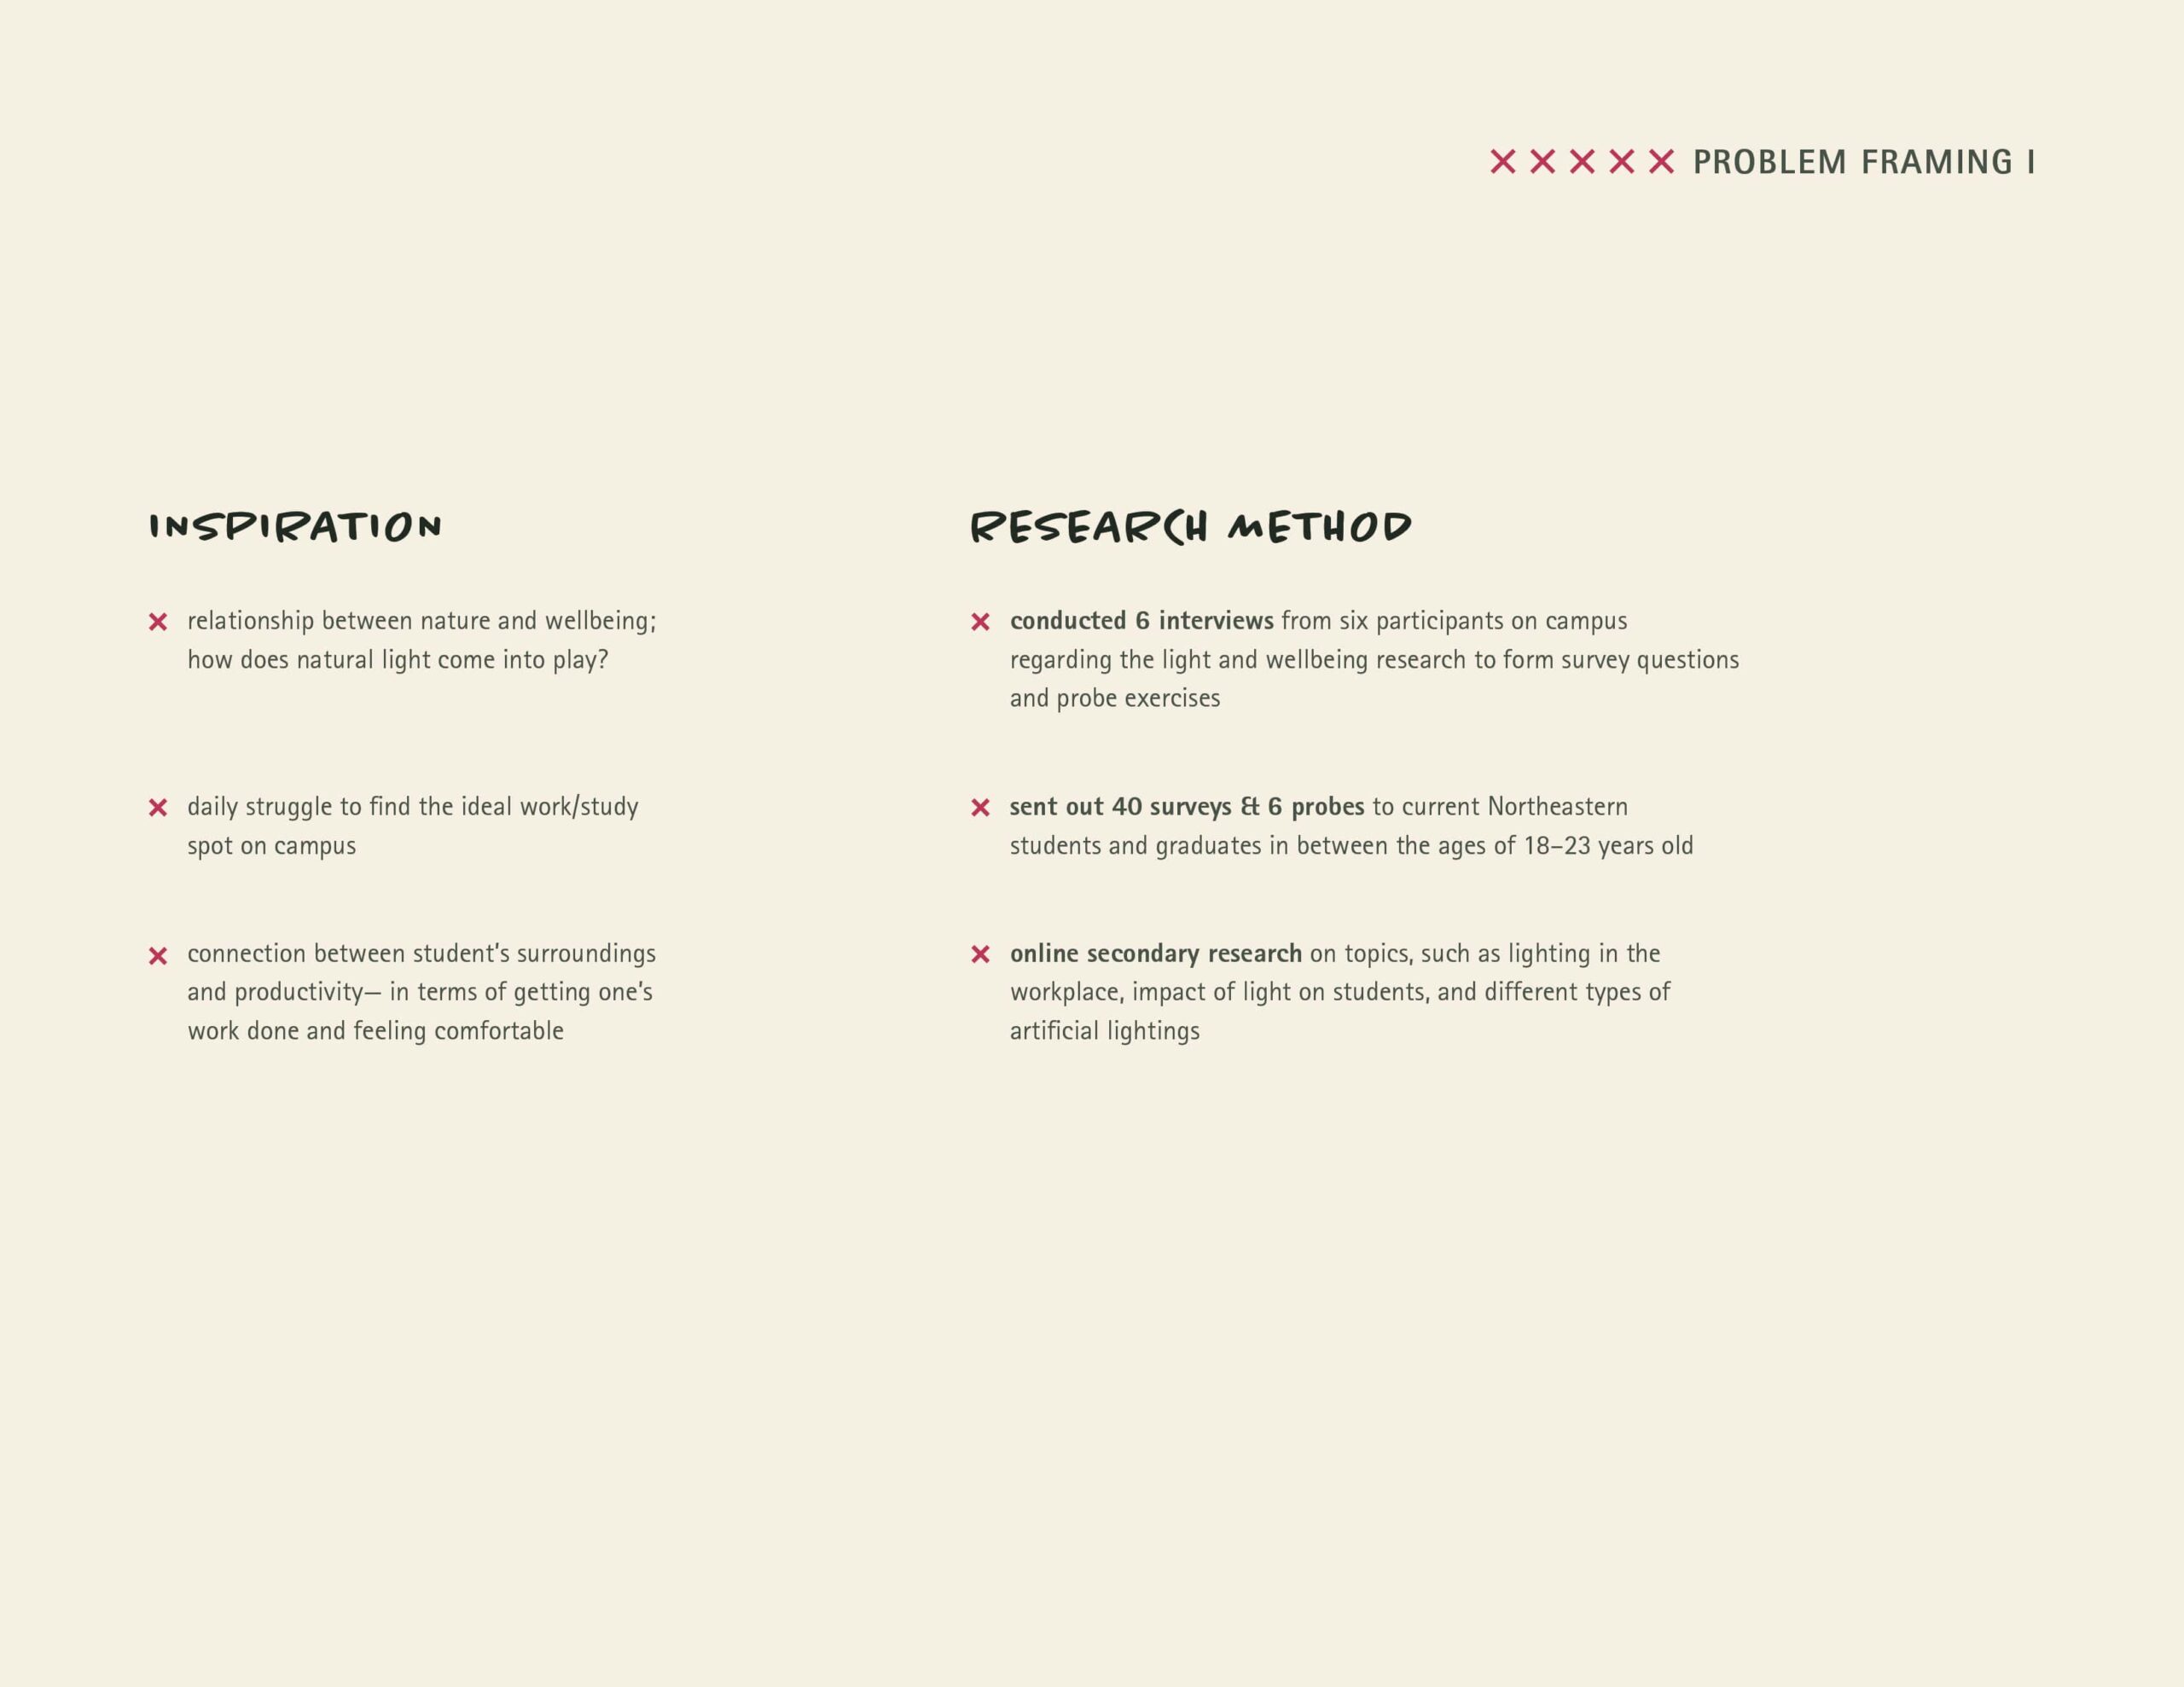
User Research
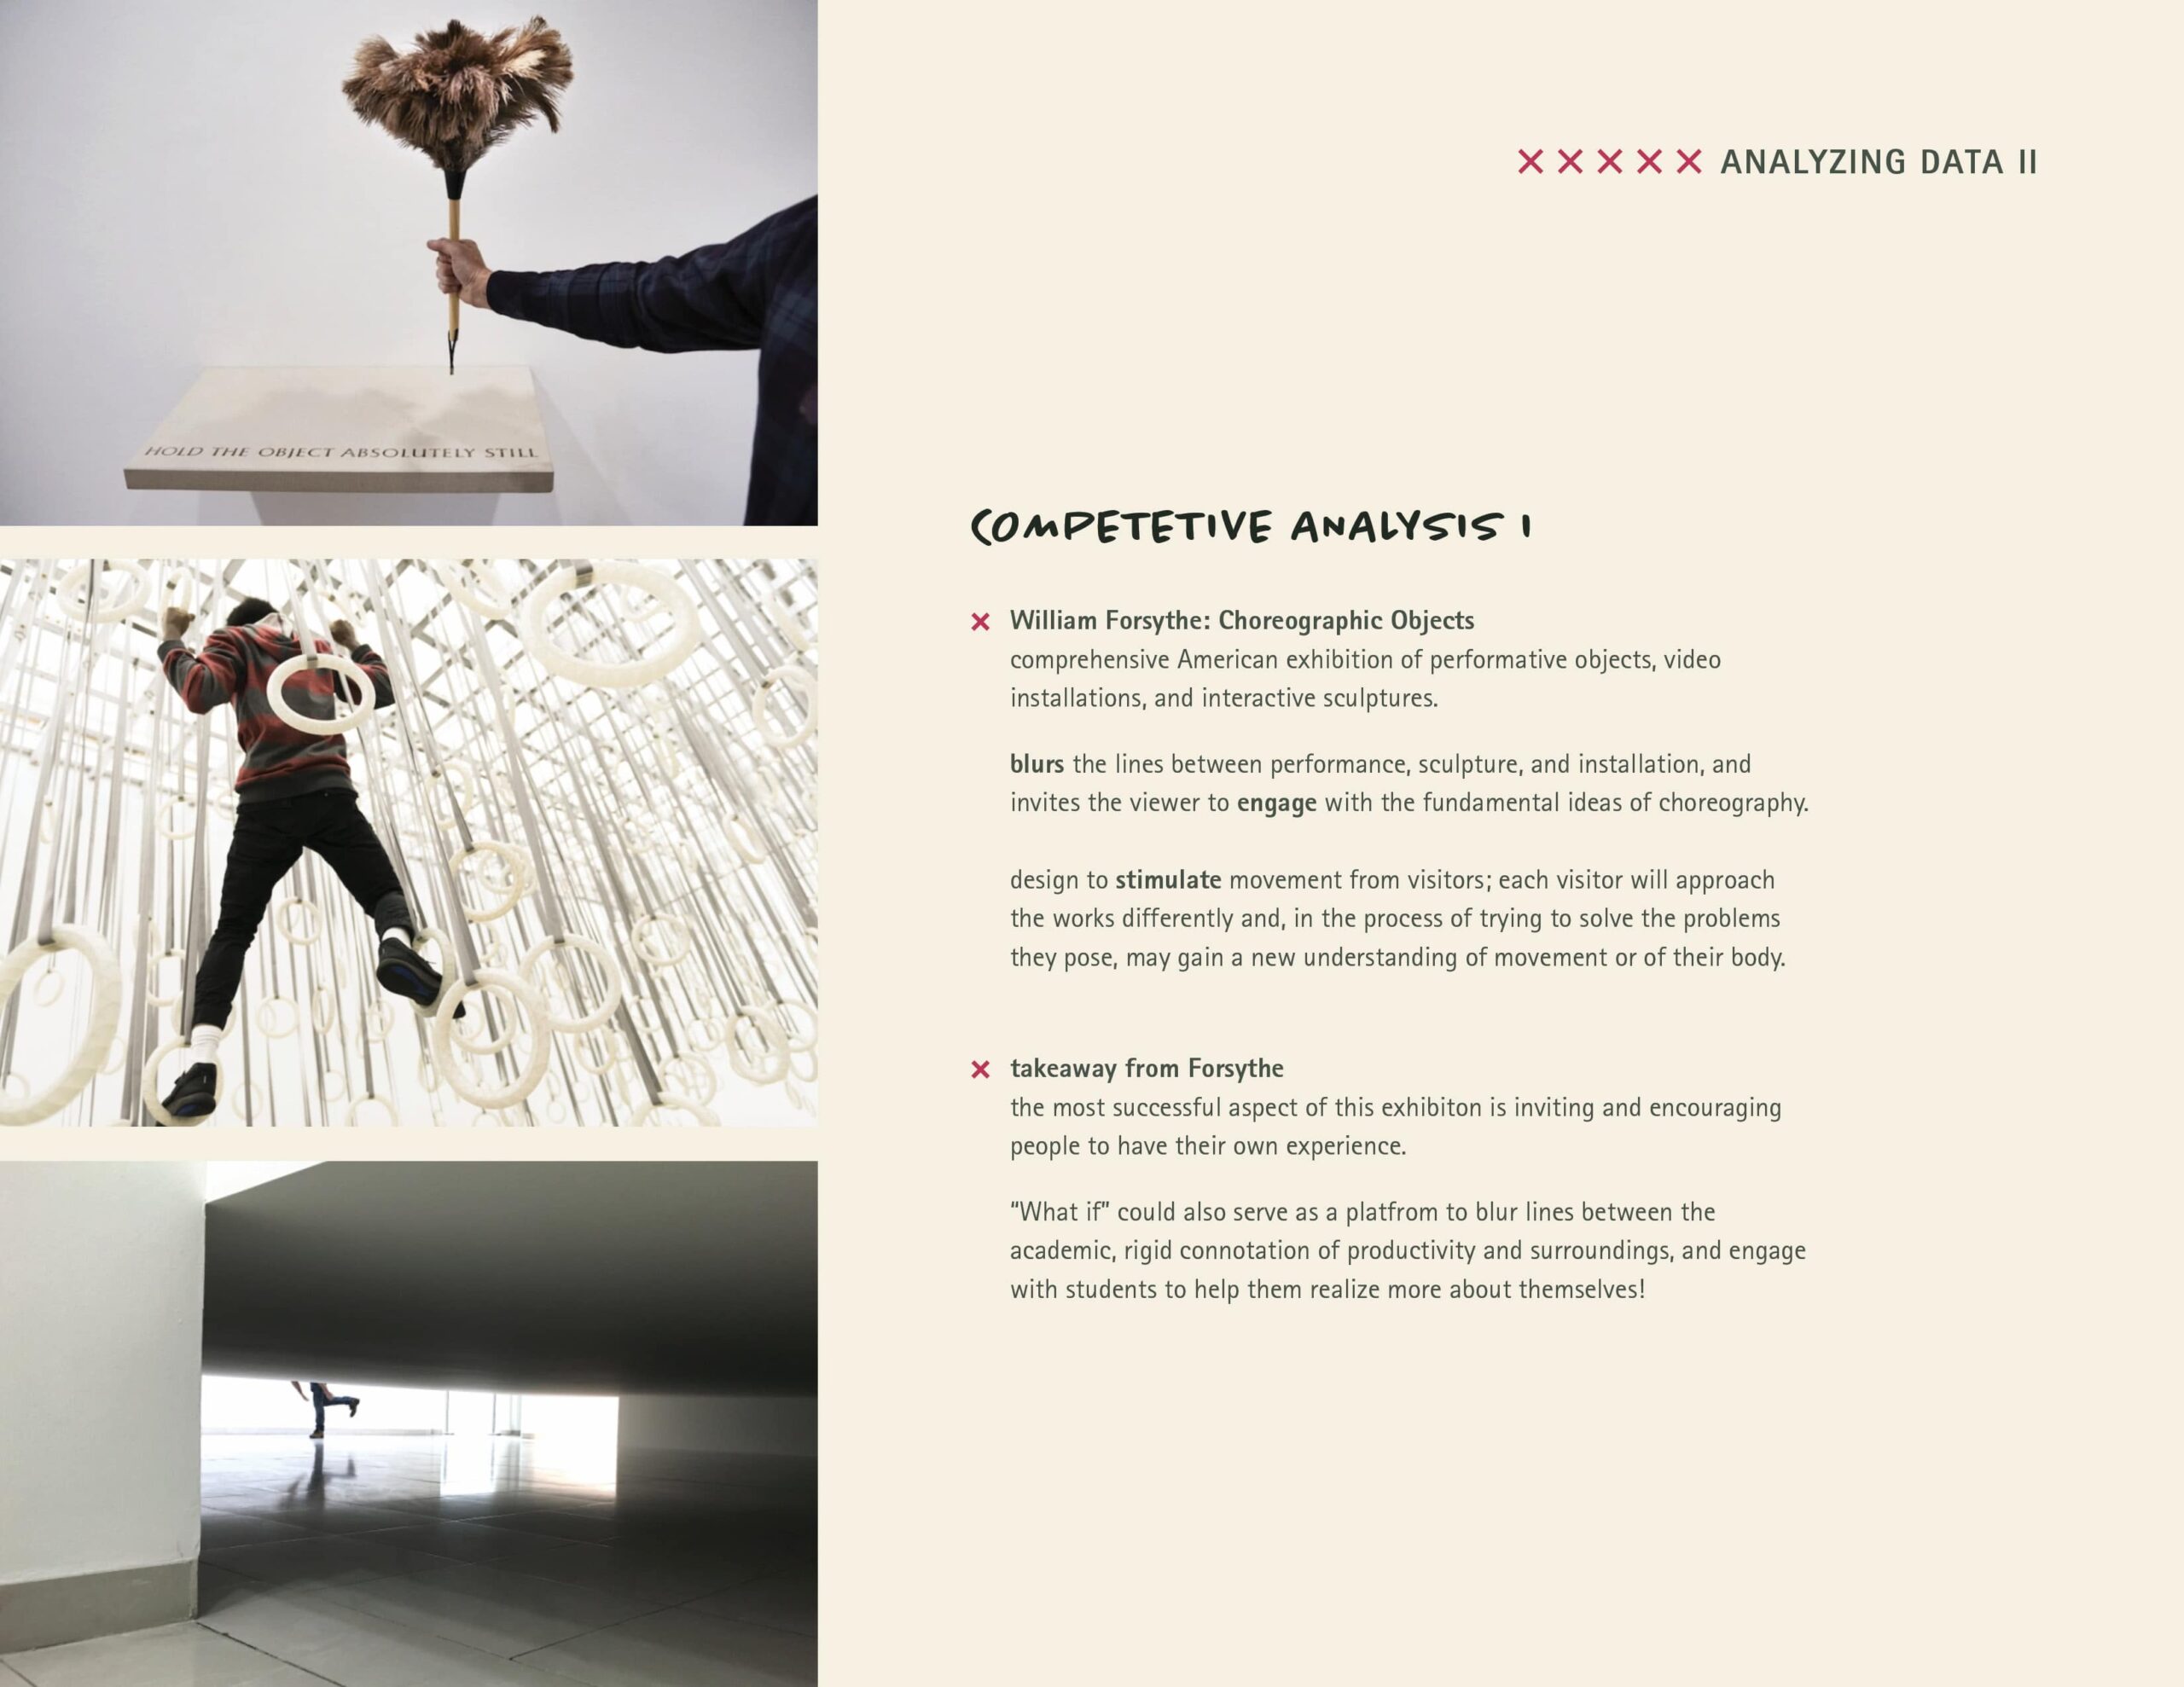
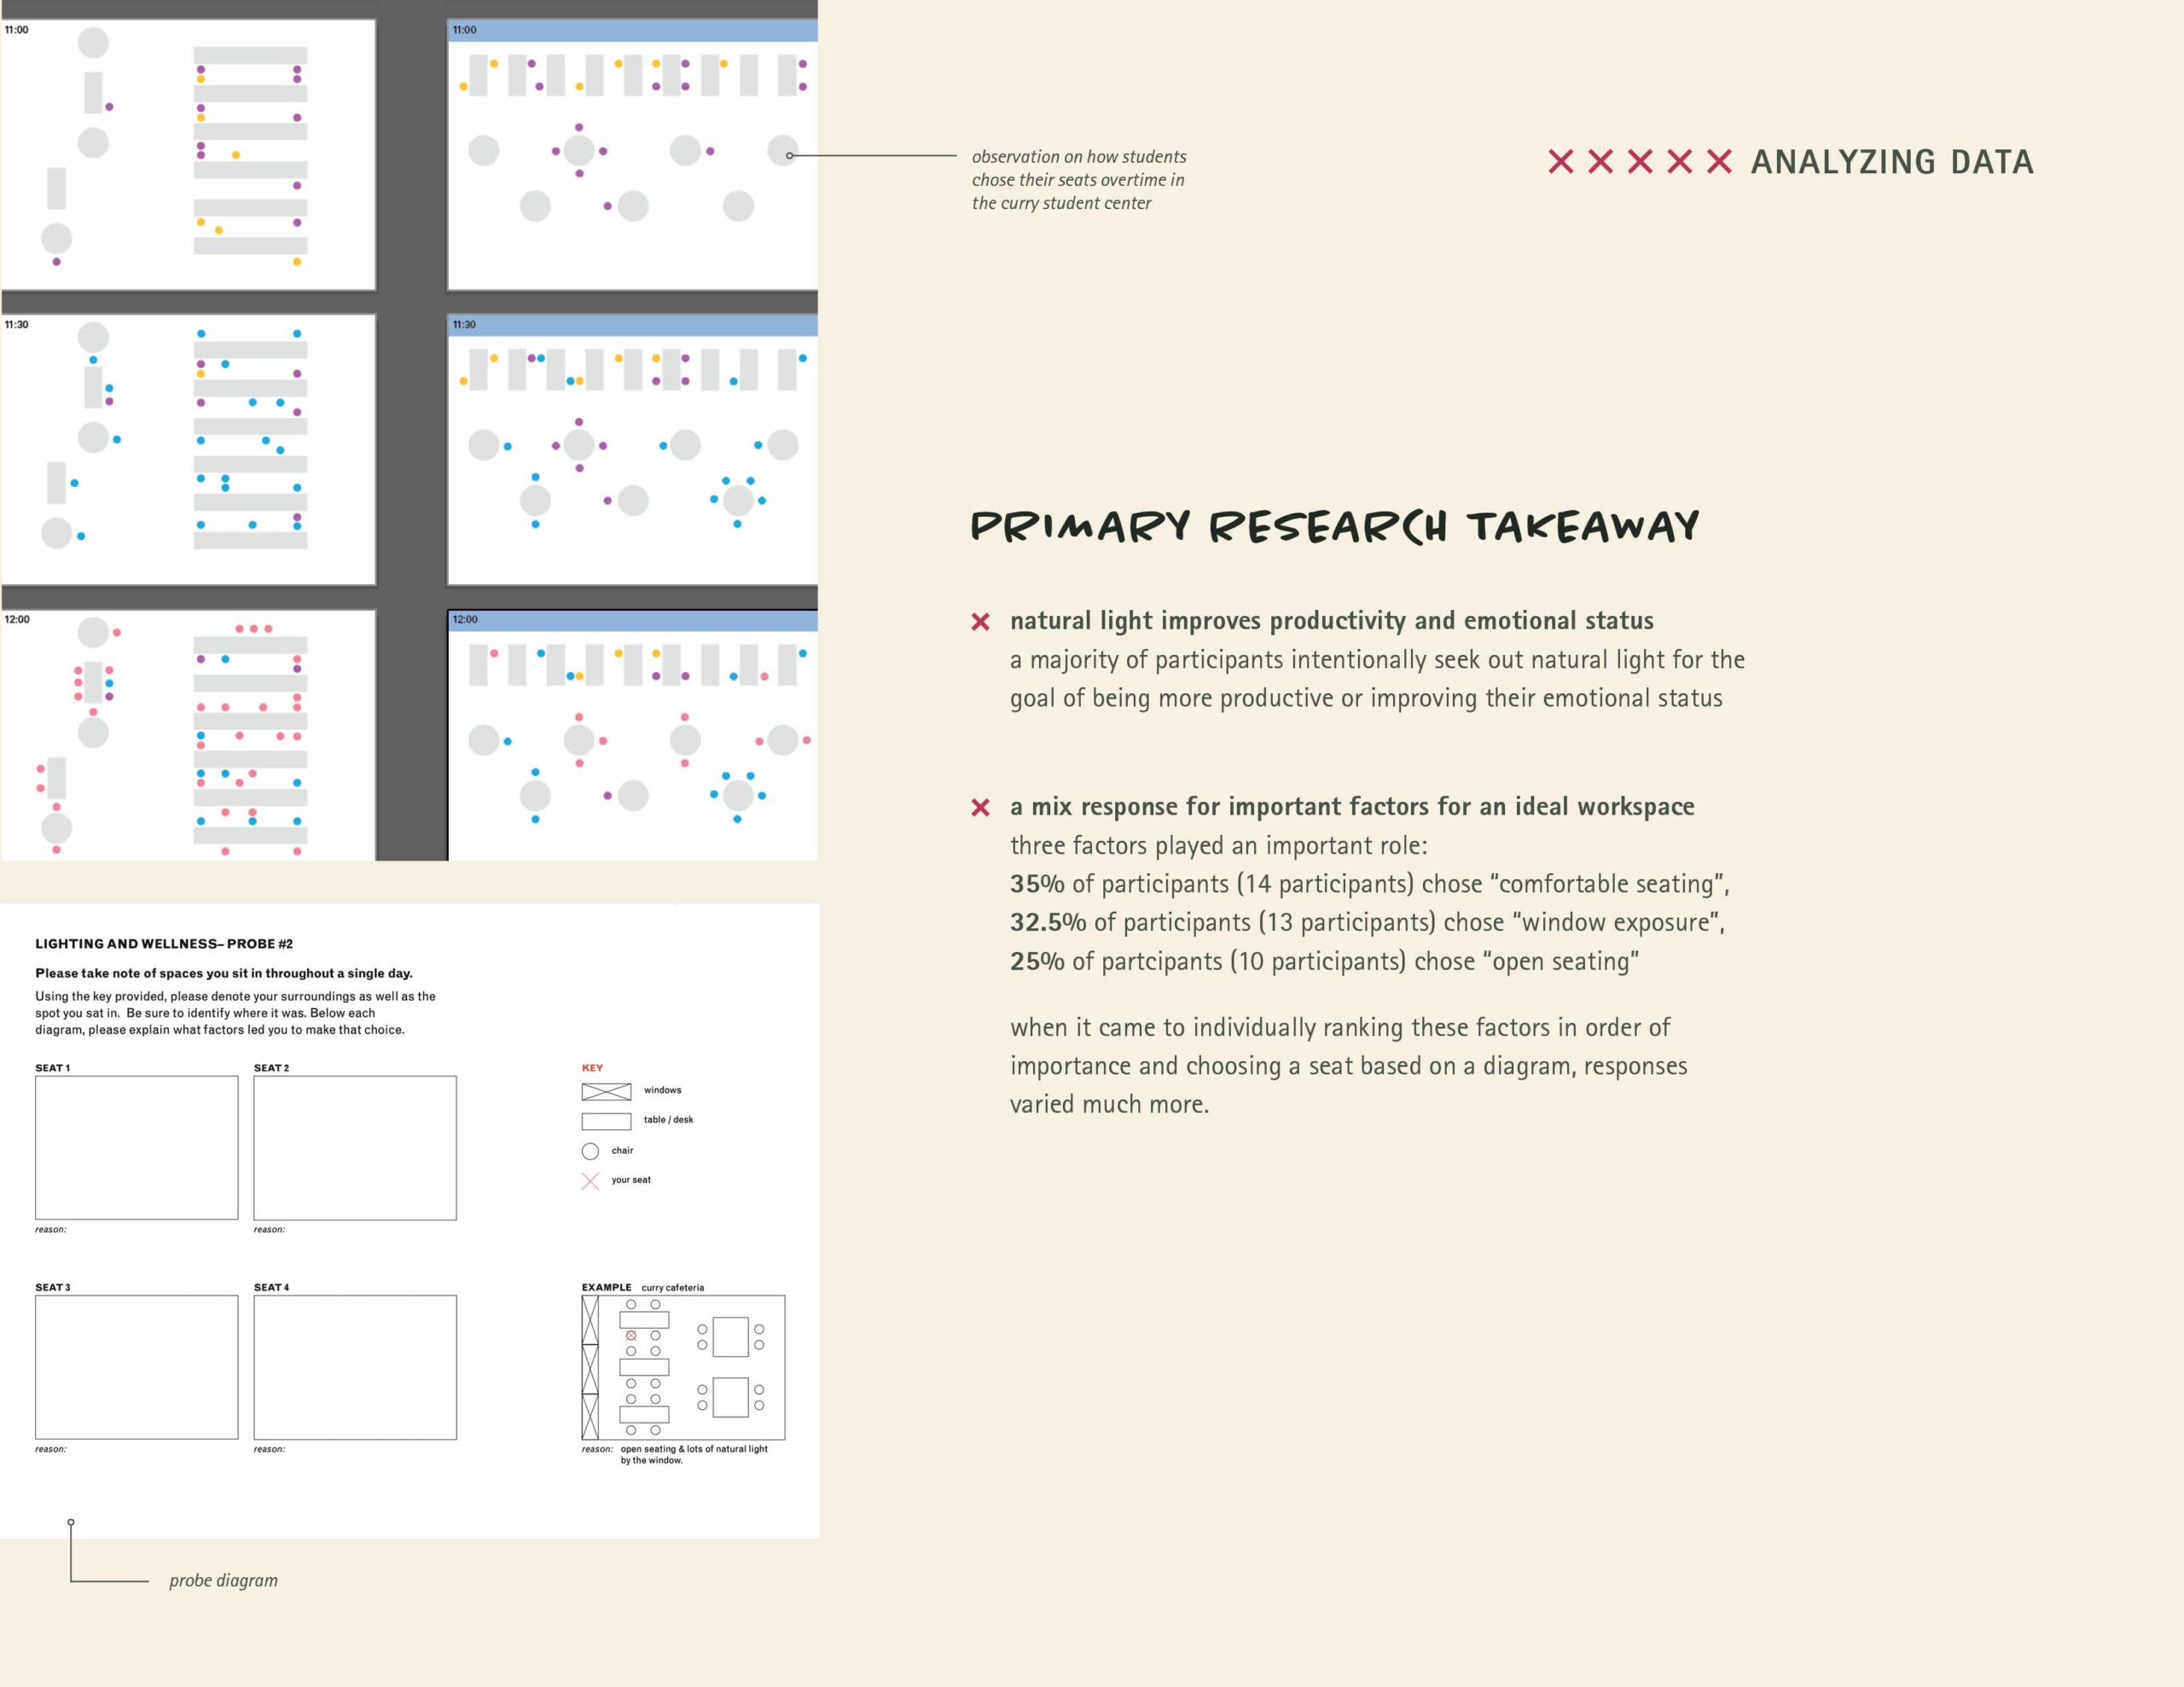
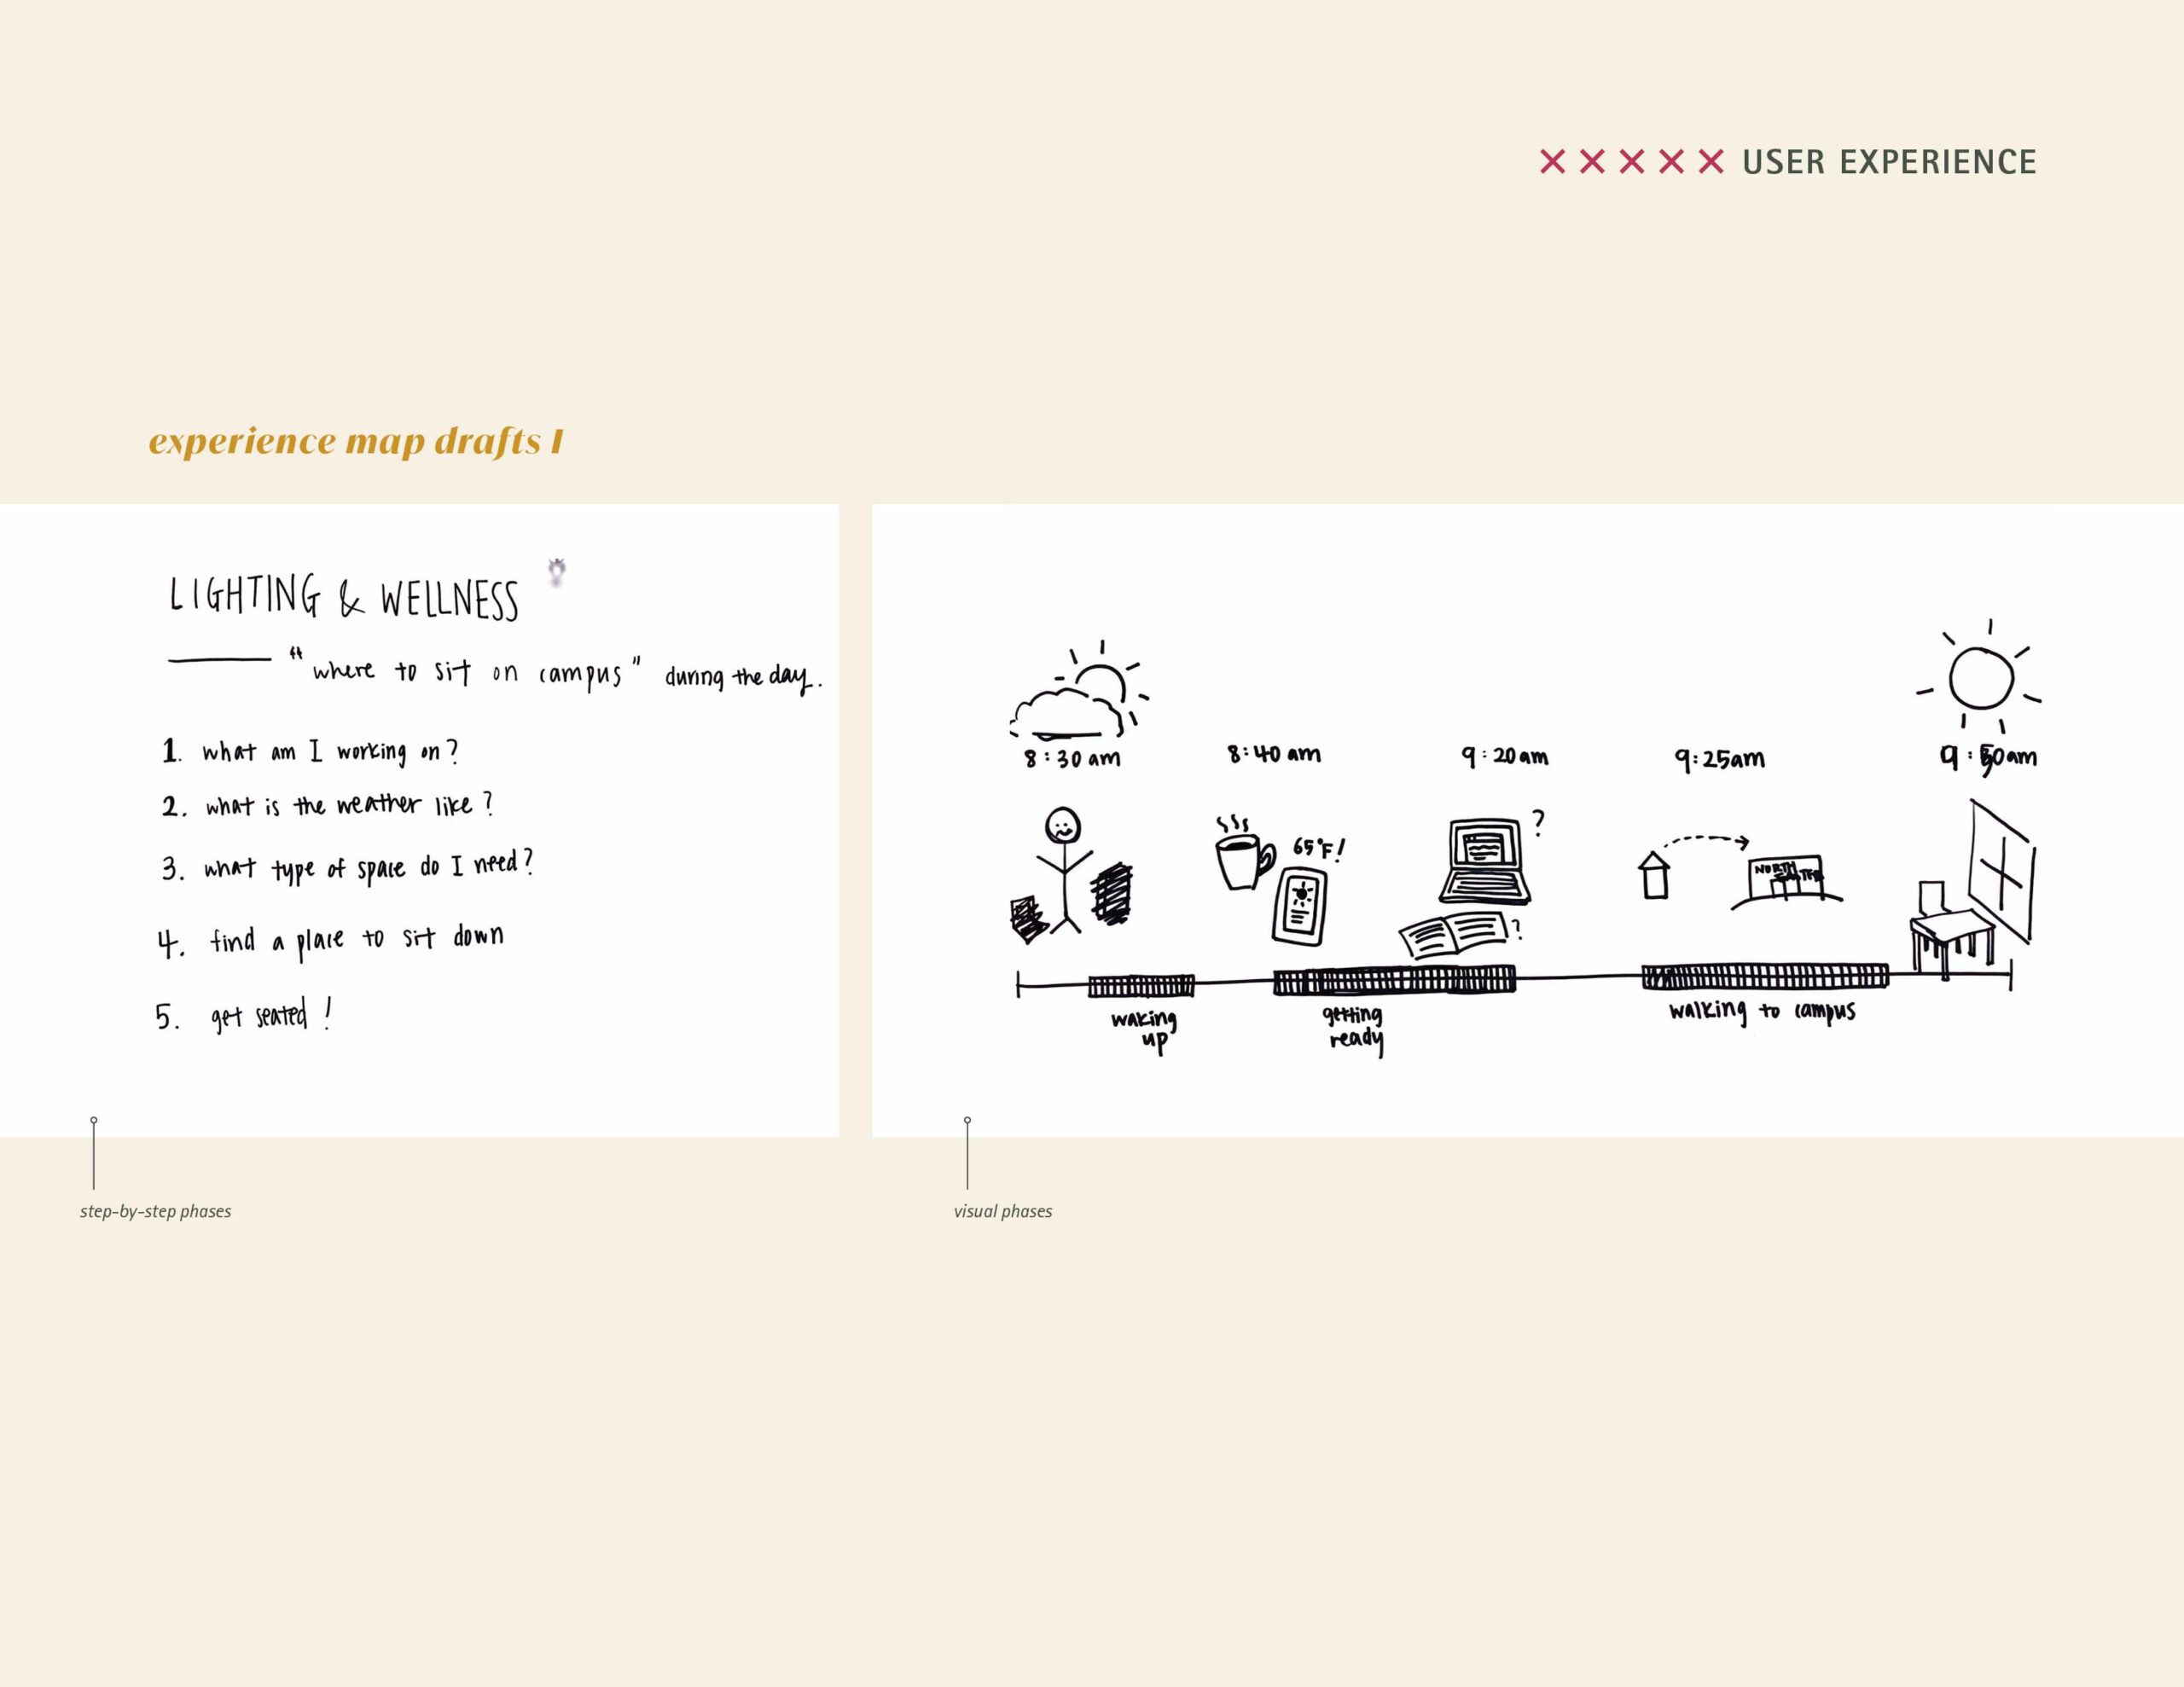
After delineating the pain points and putting together a user journey, I conducted user research through interviews, surveys, and online market research.
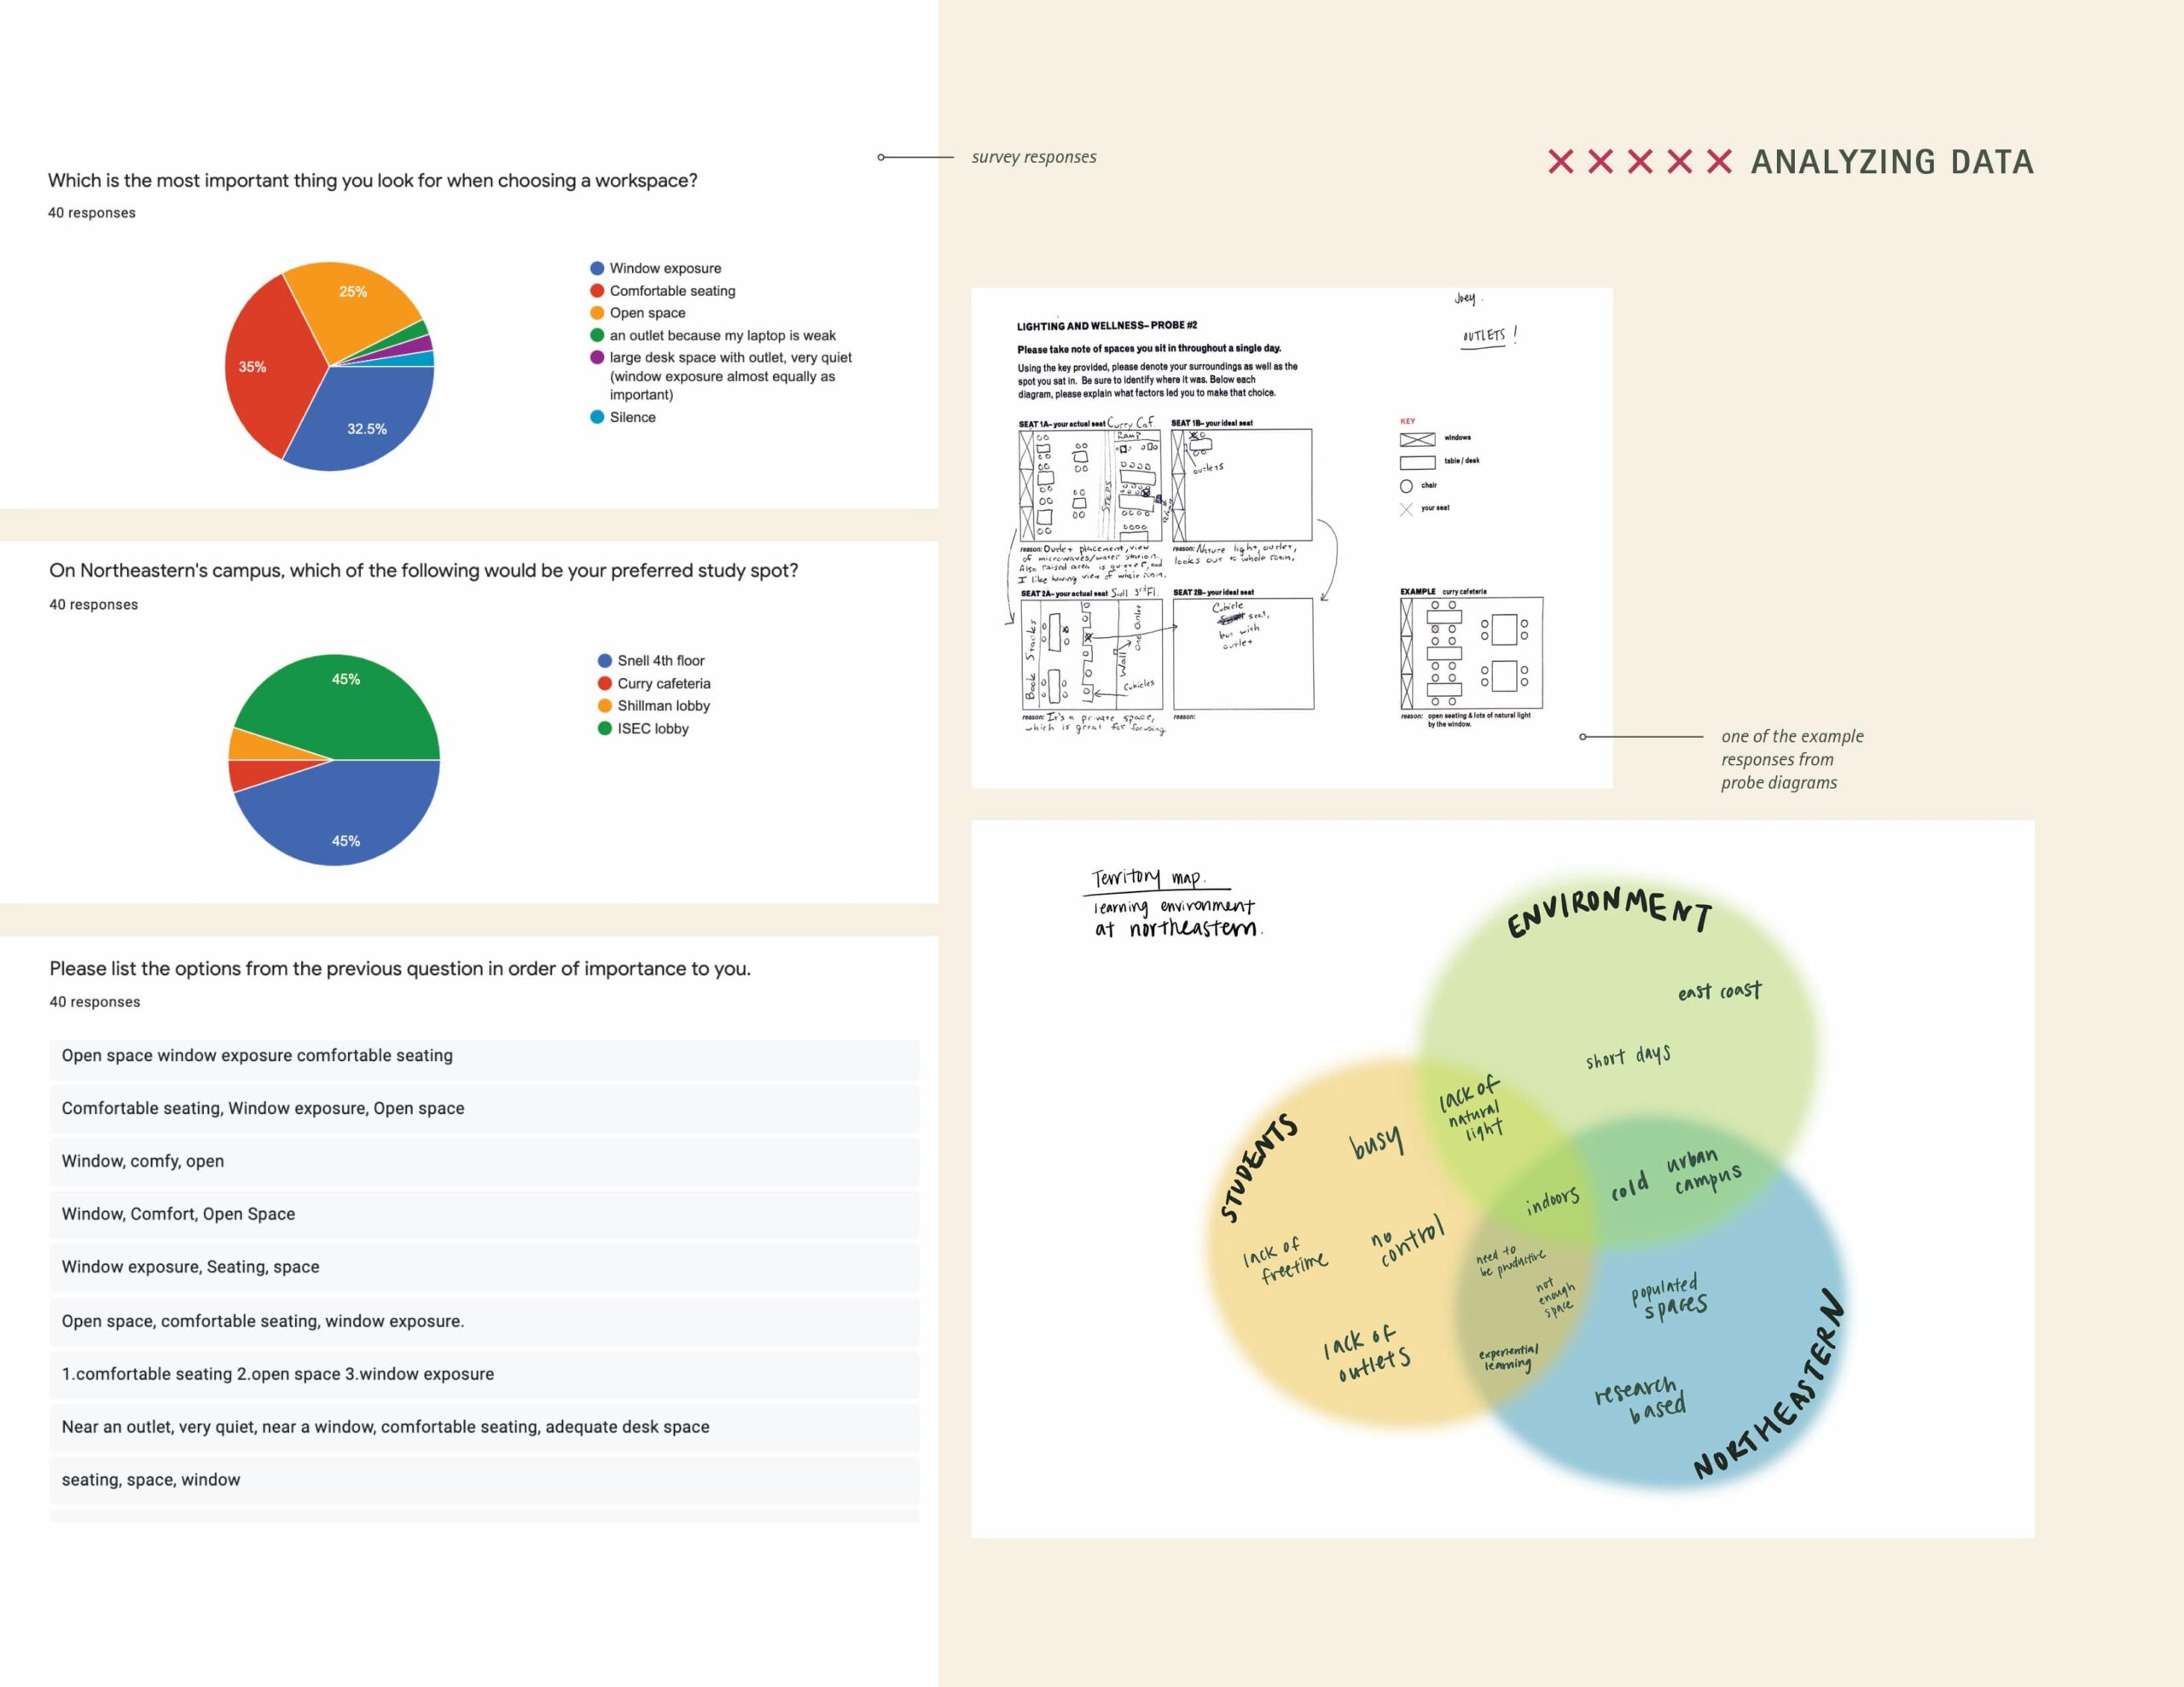
Instead of reviewing the survey results as simple statistics and data sets, I wanted to explore different visualization methods to make them more approachable and eye-catching to showcase the similarities and differences in people's responses.
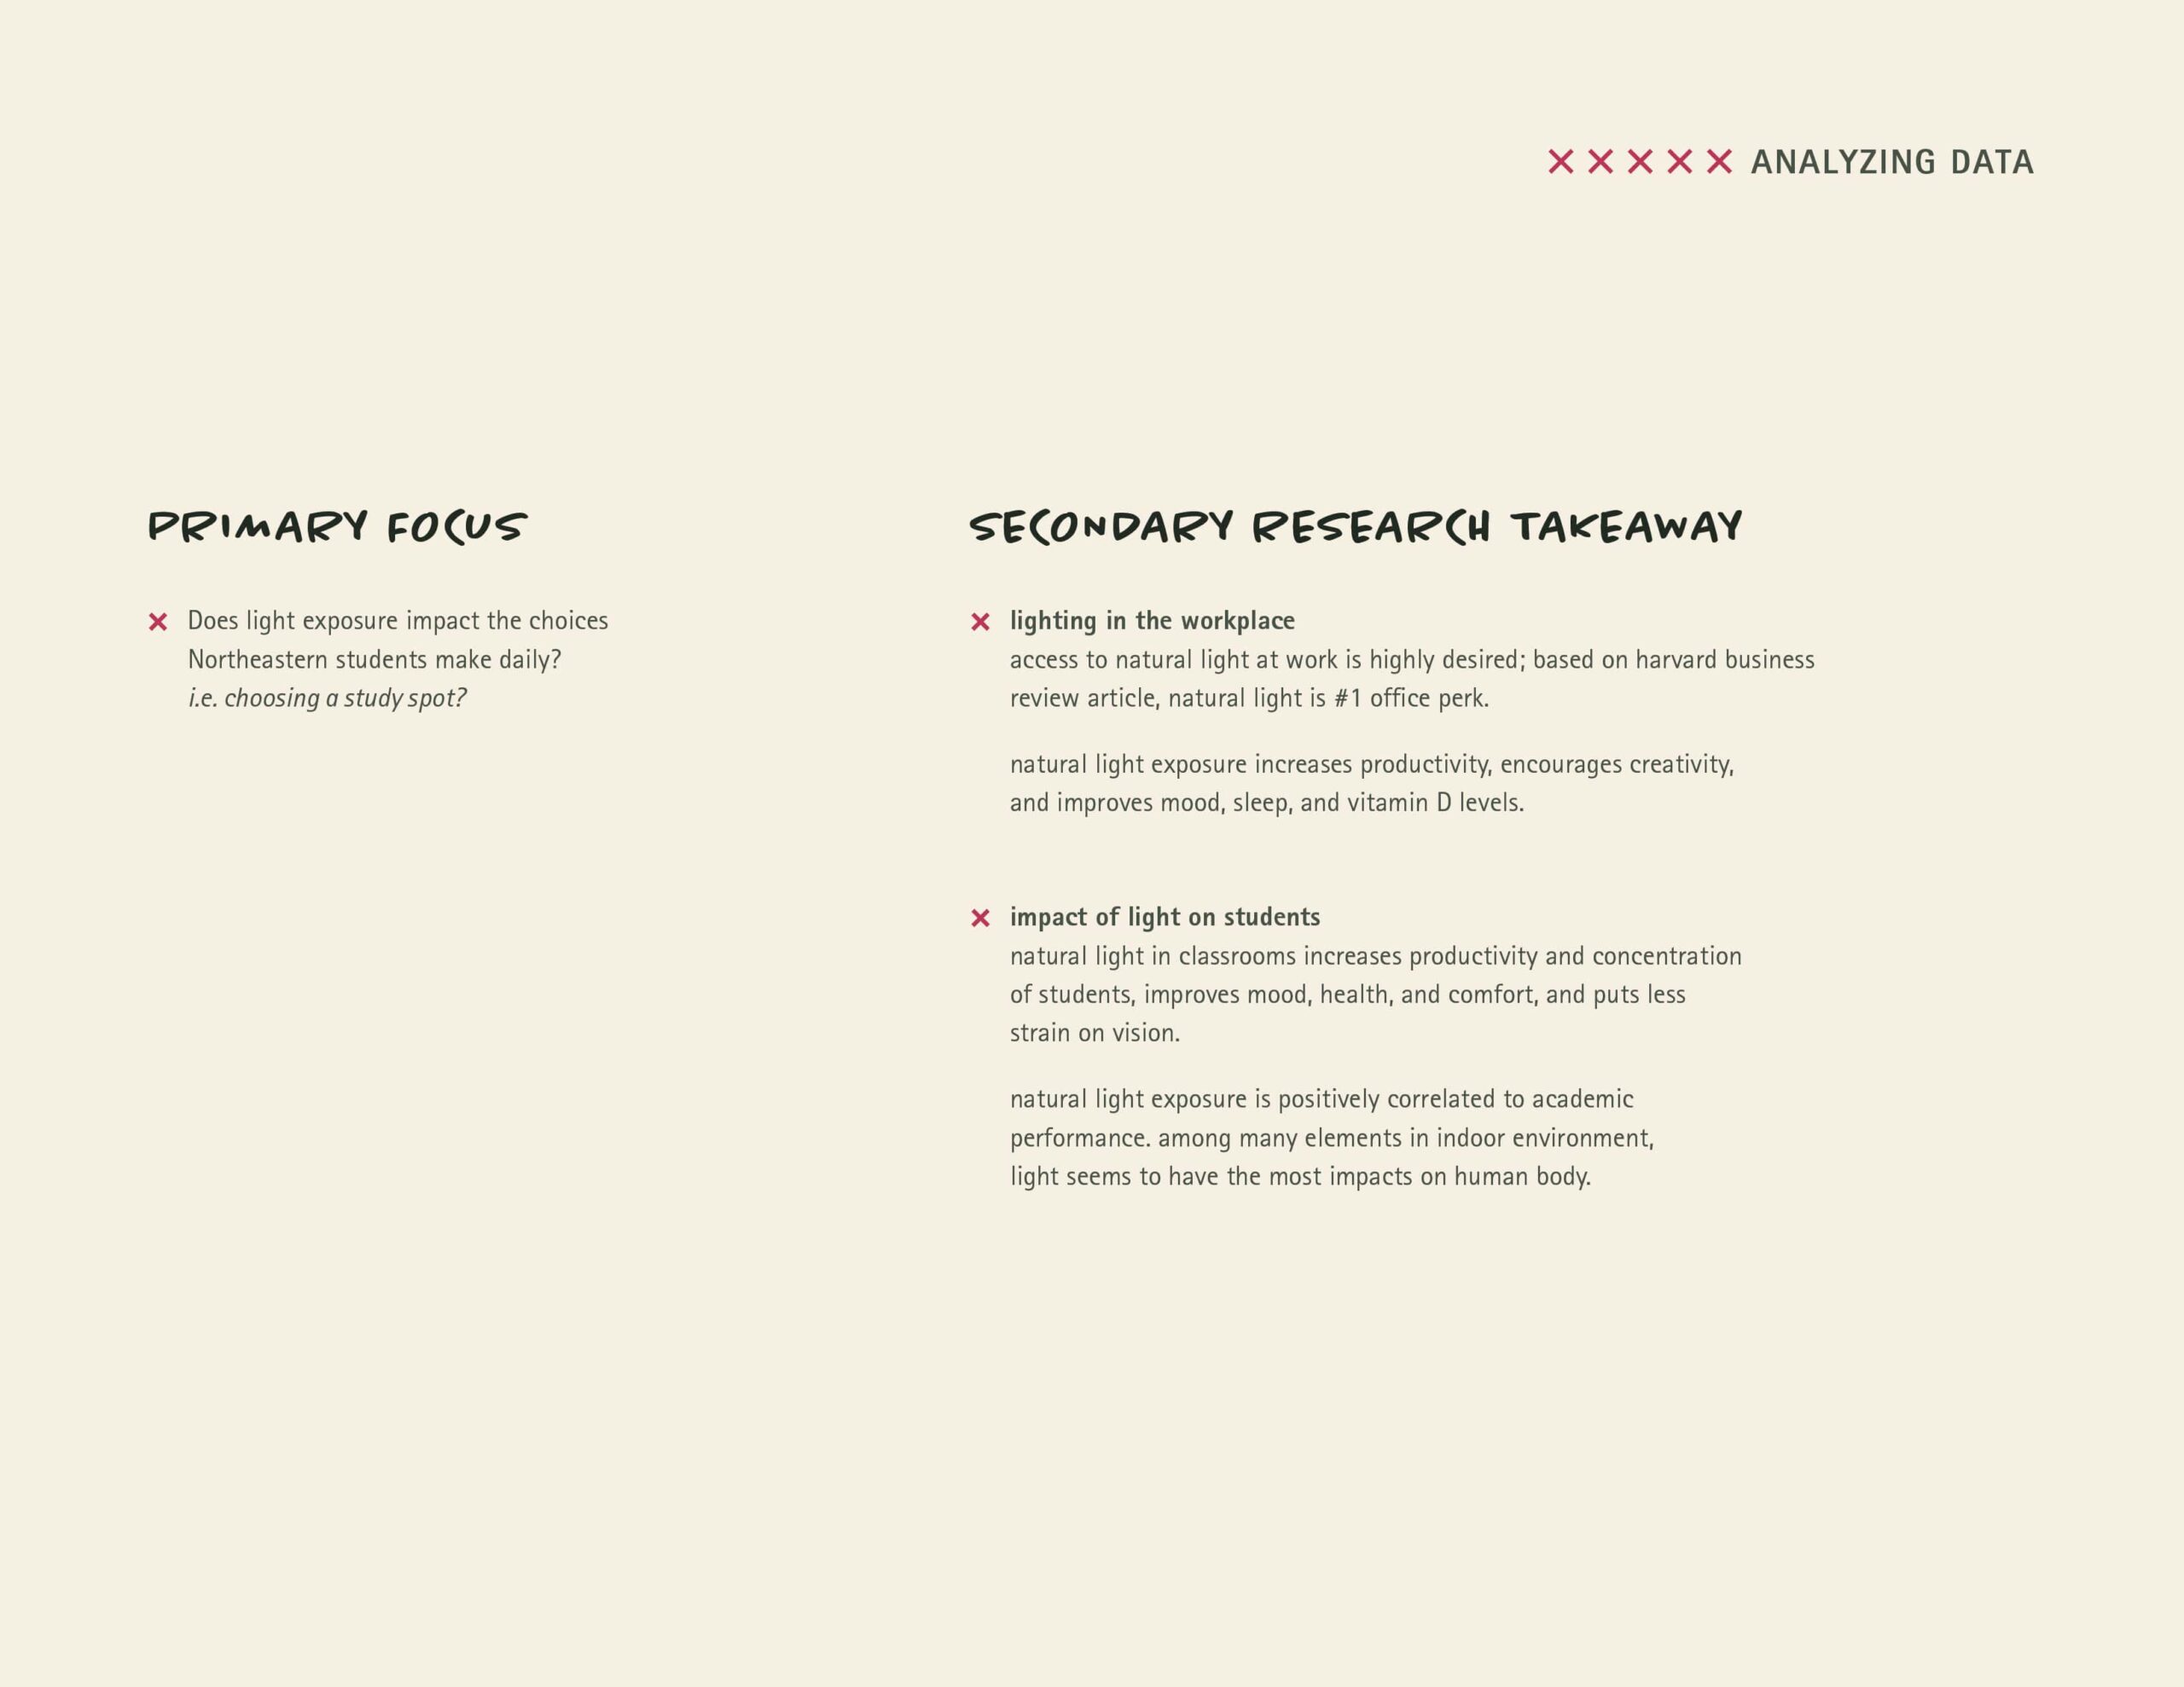
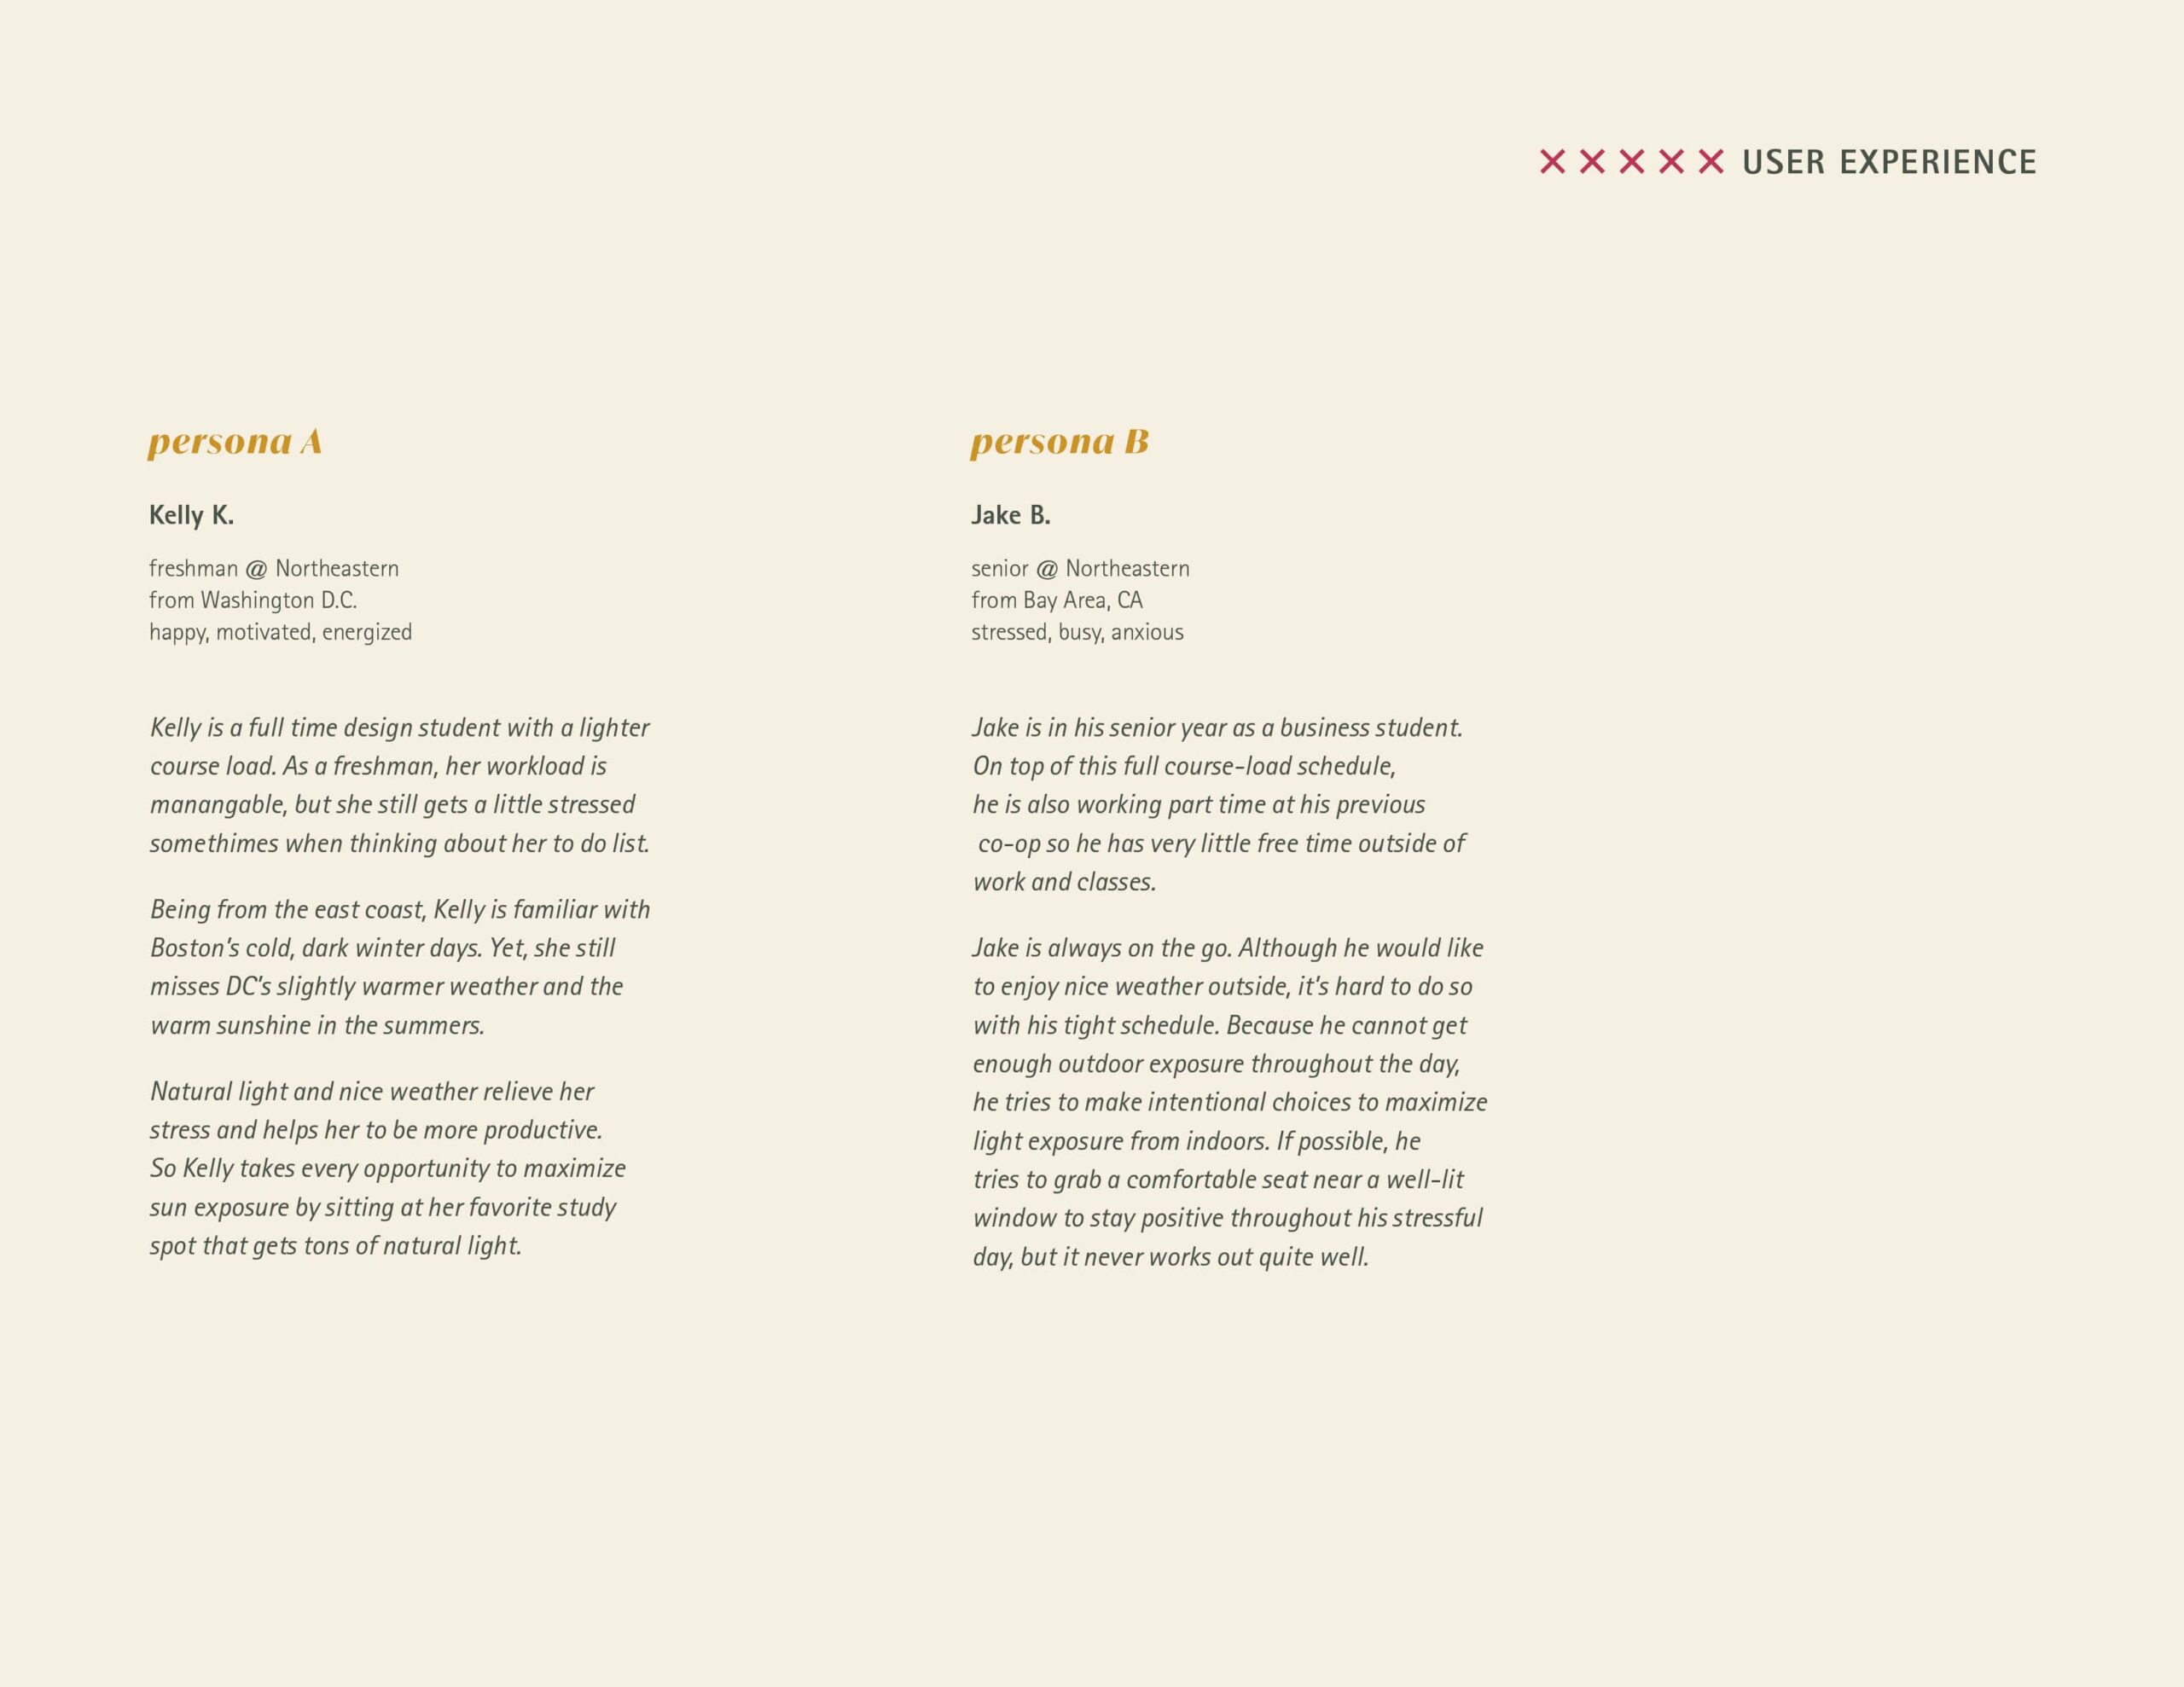
User Research Summary
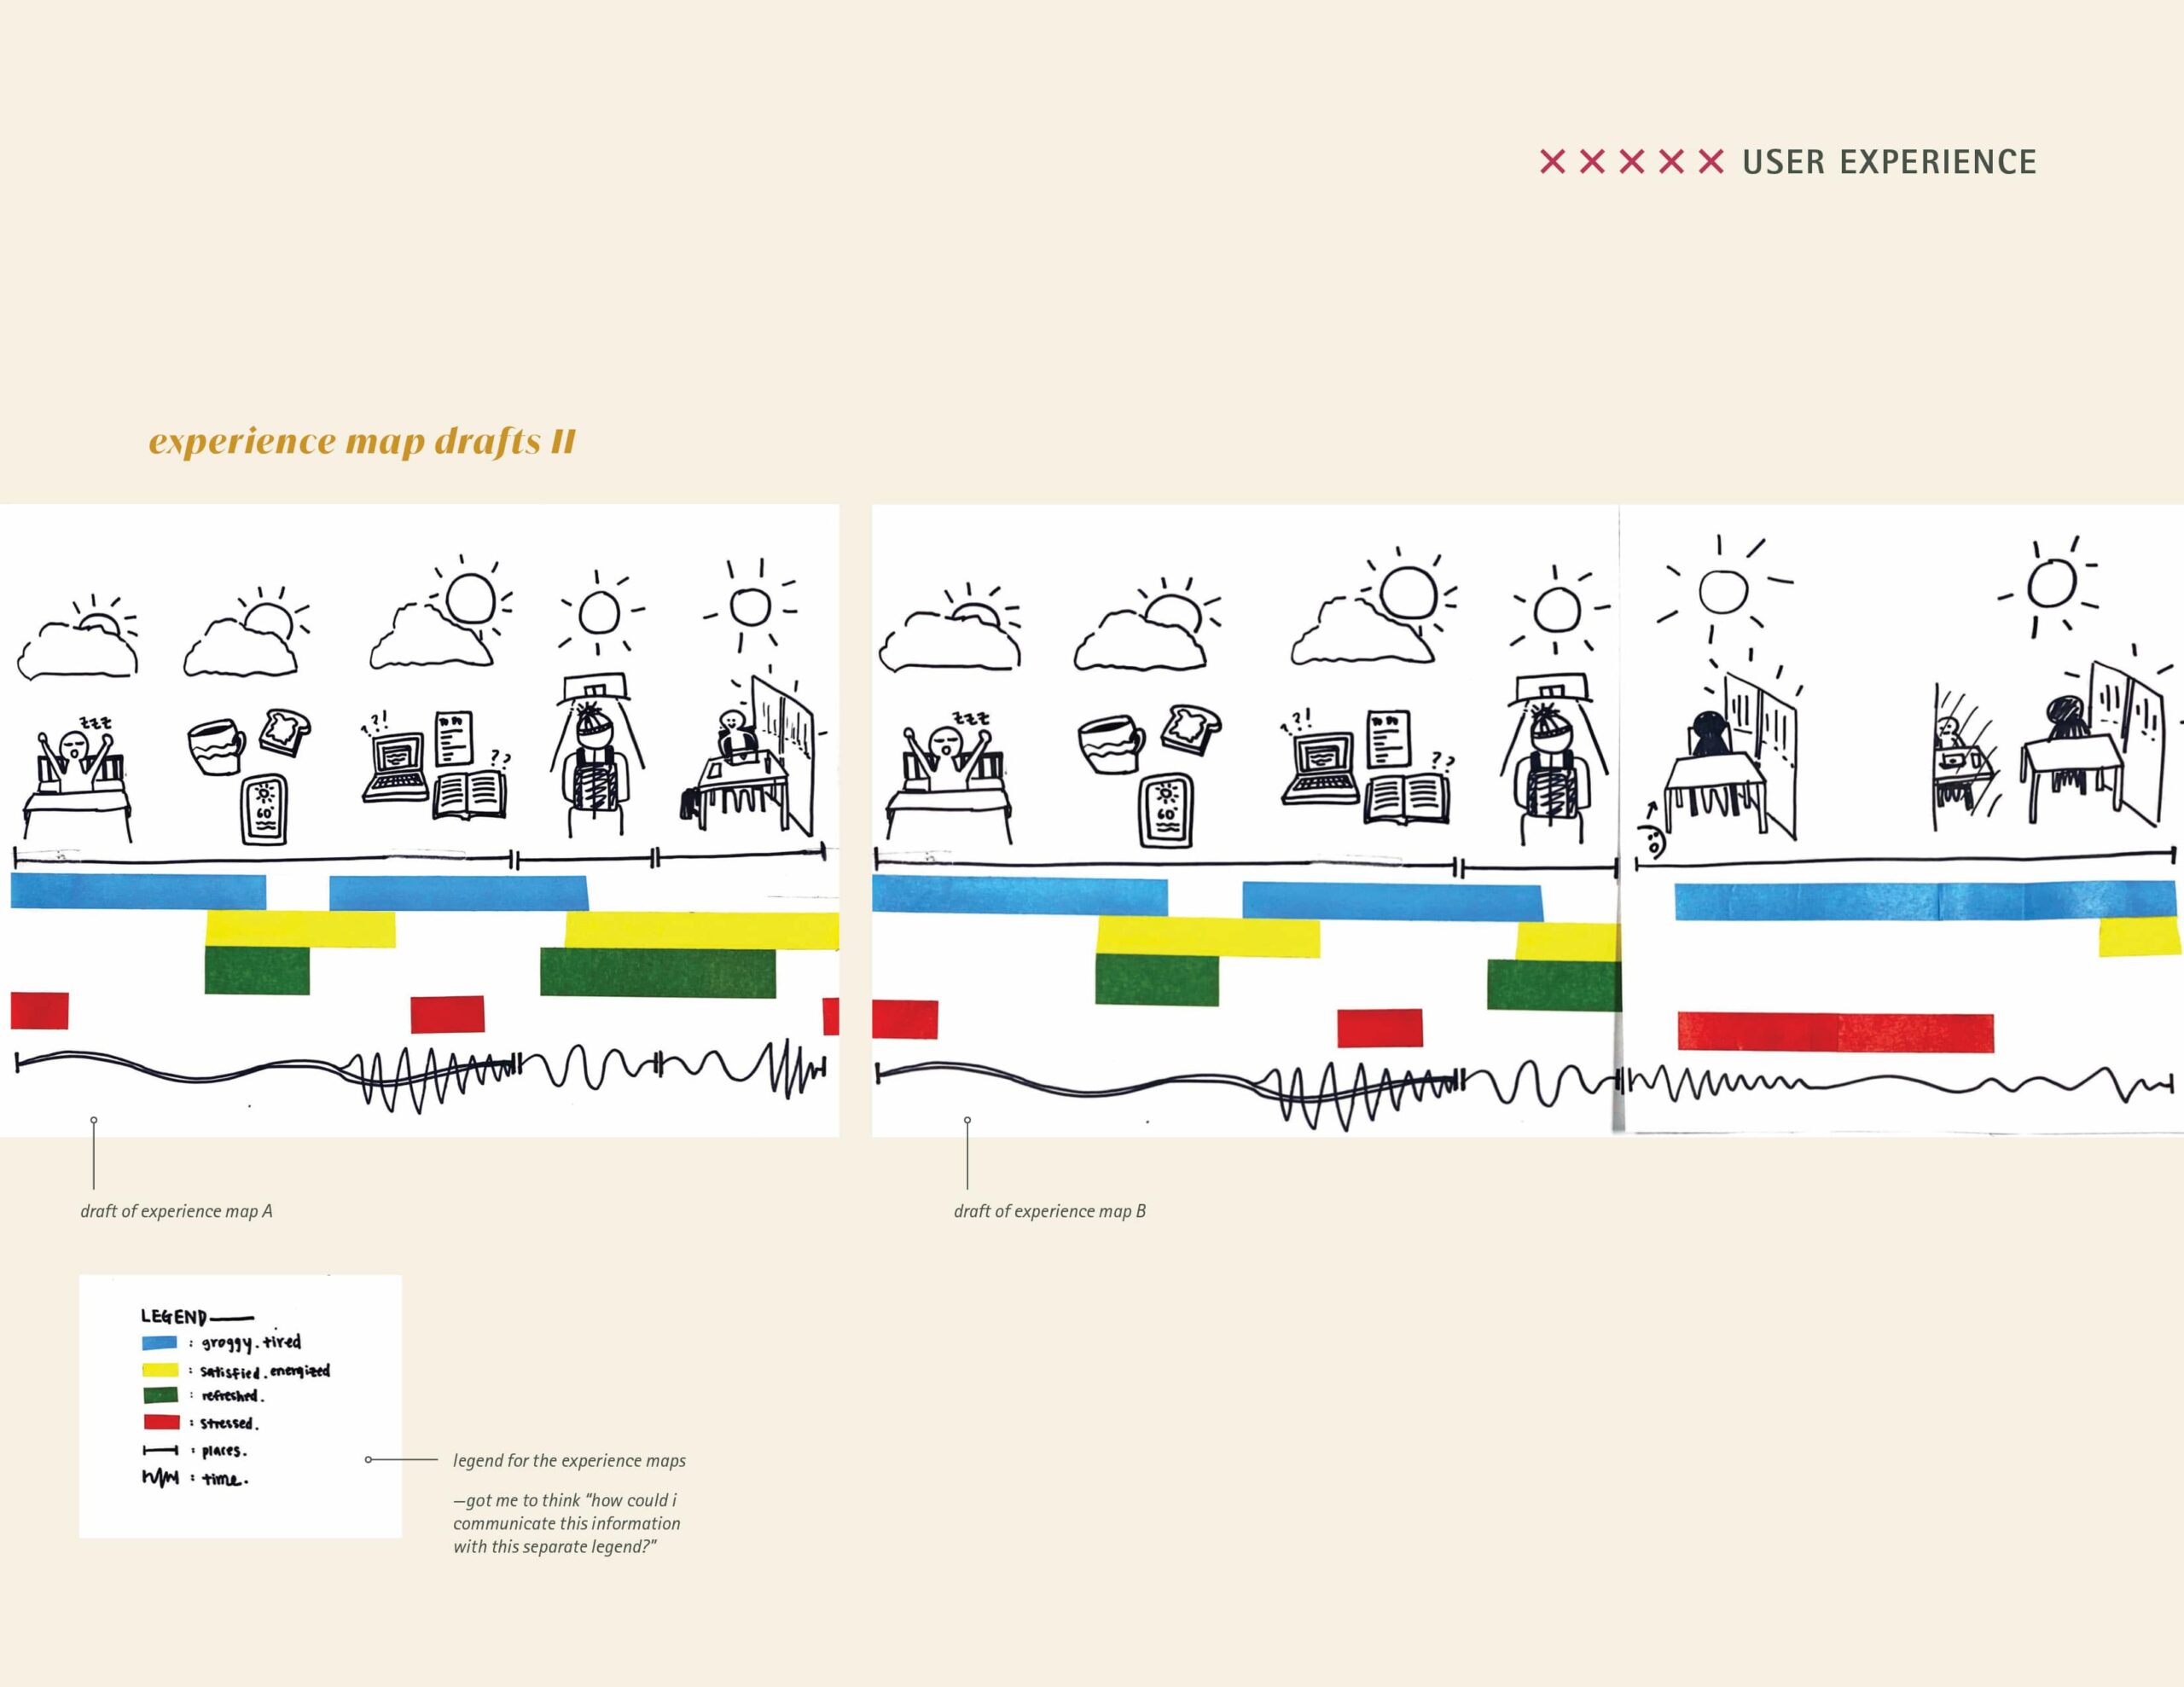
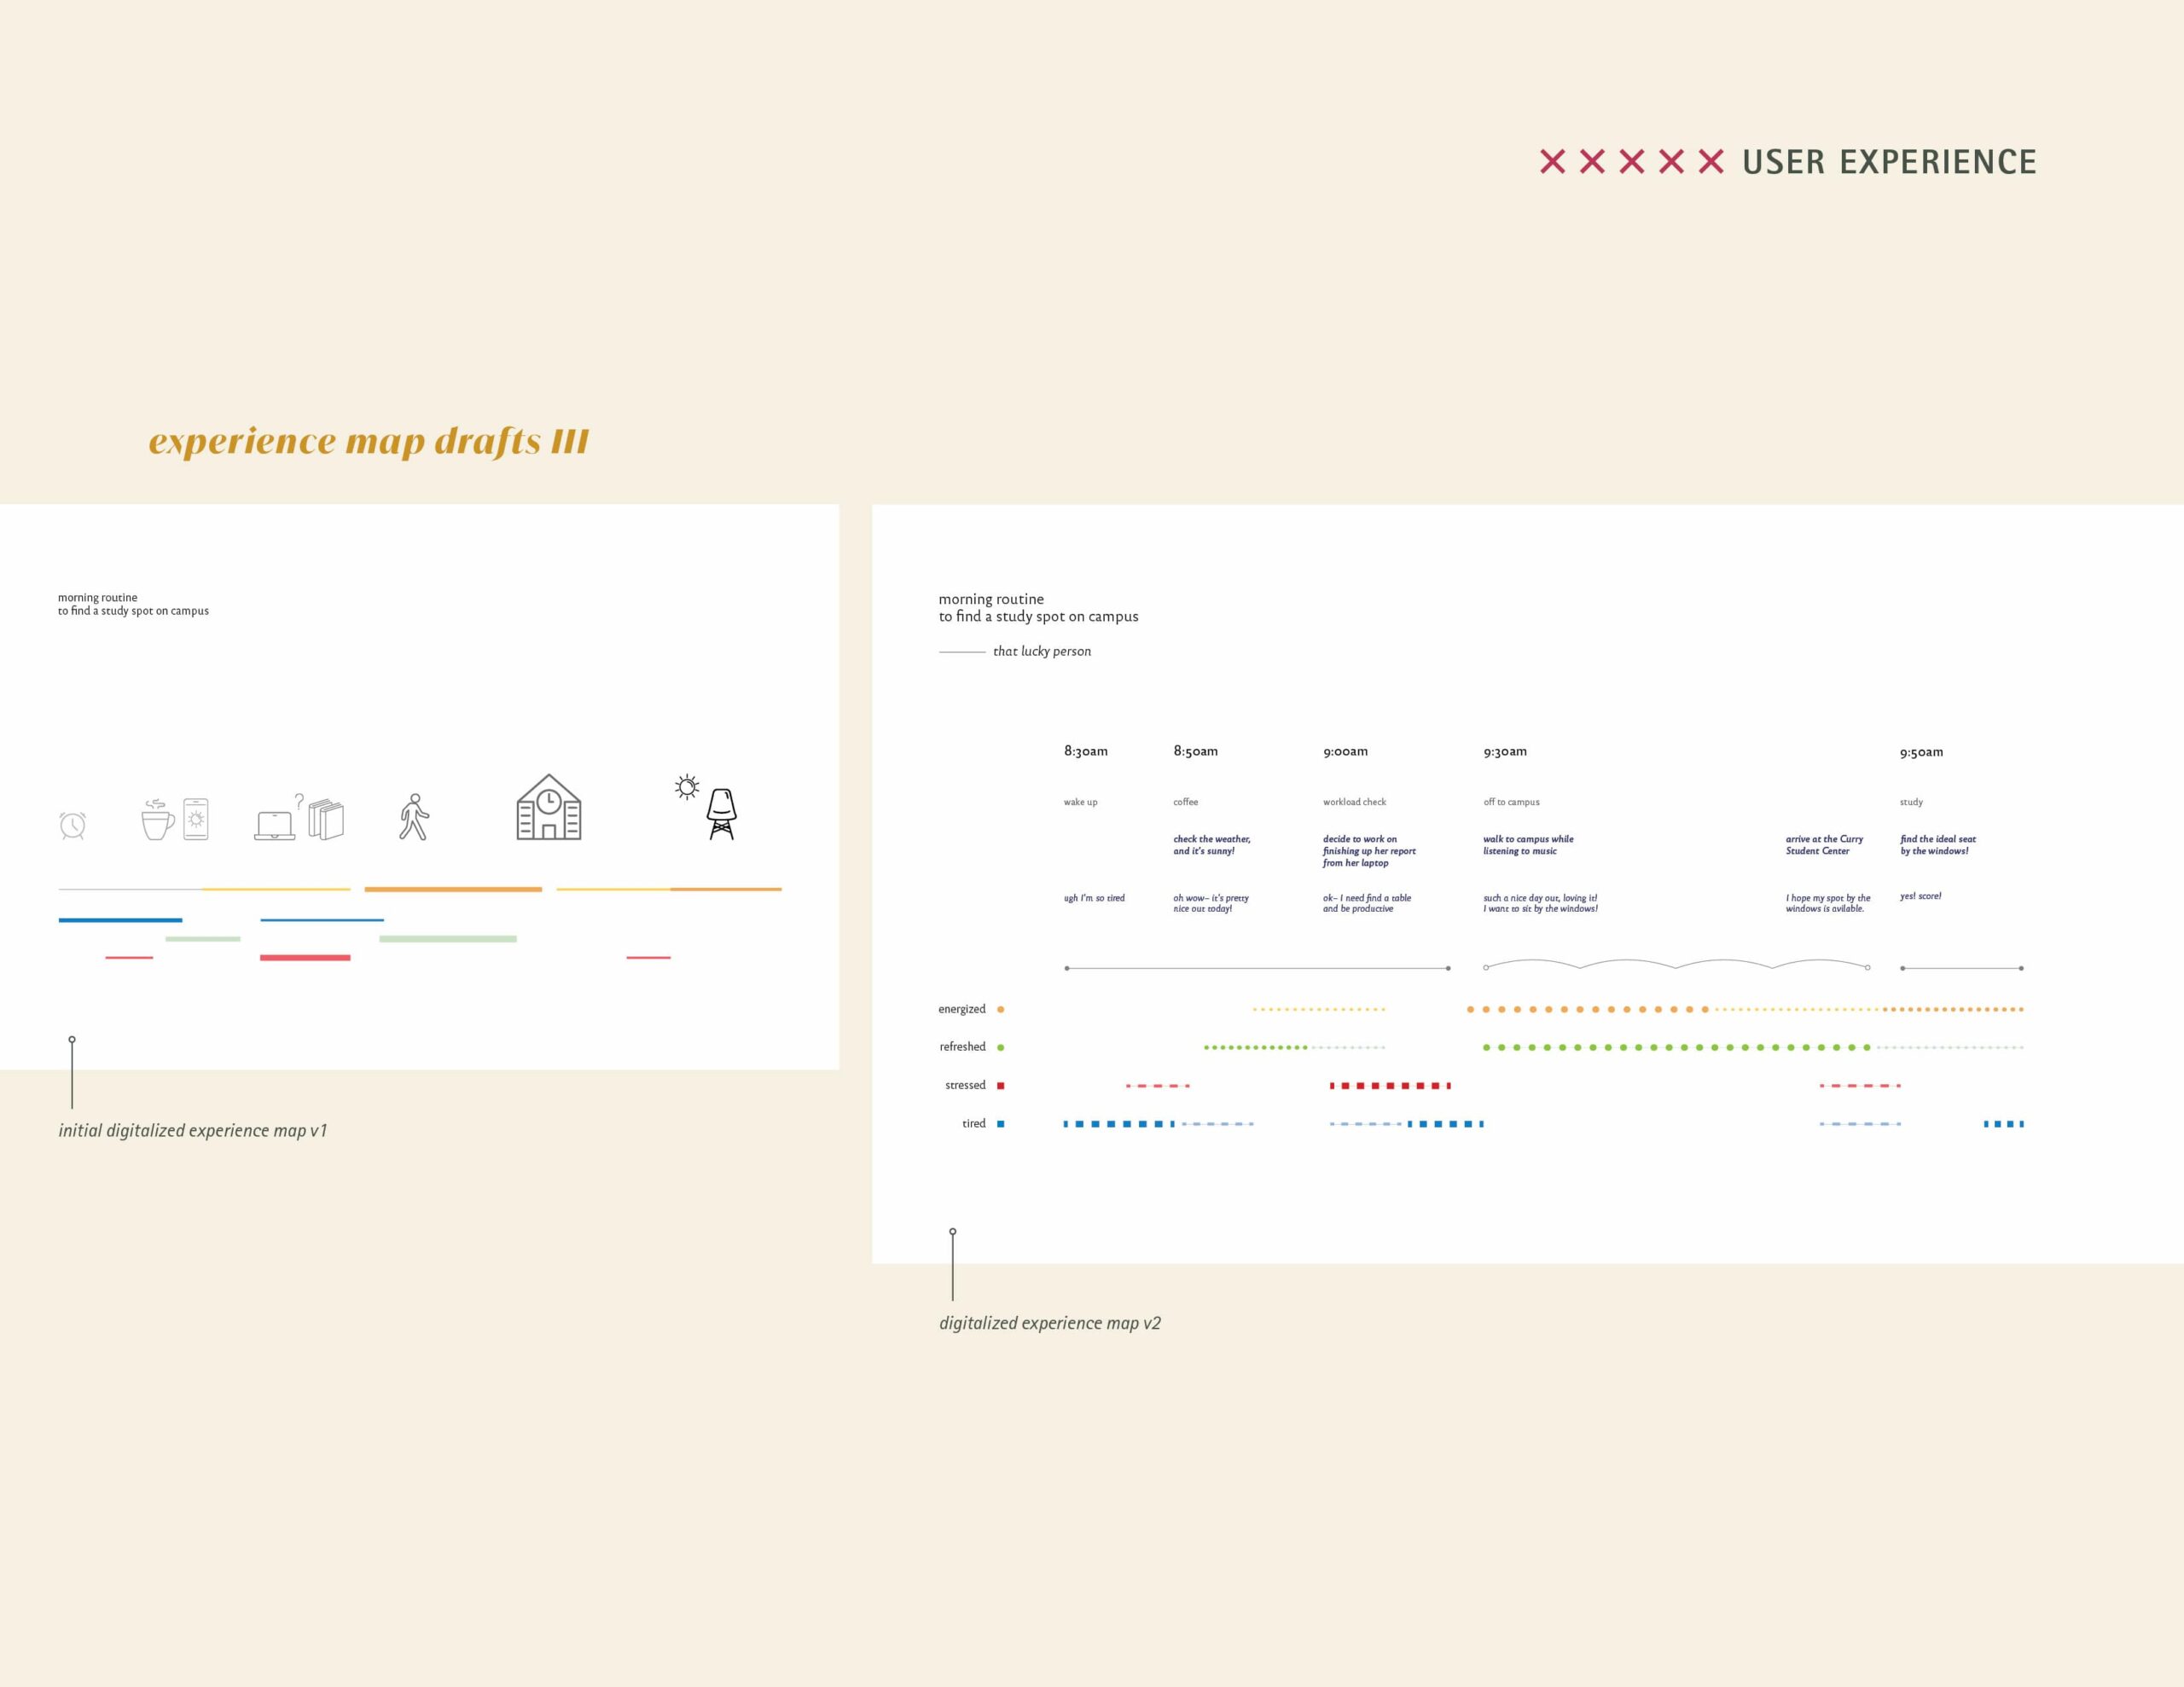
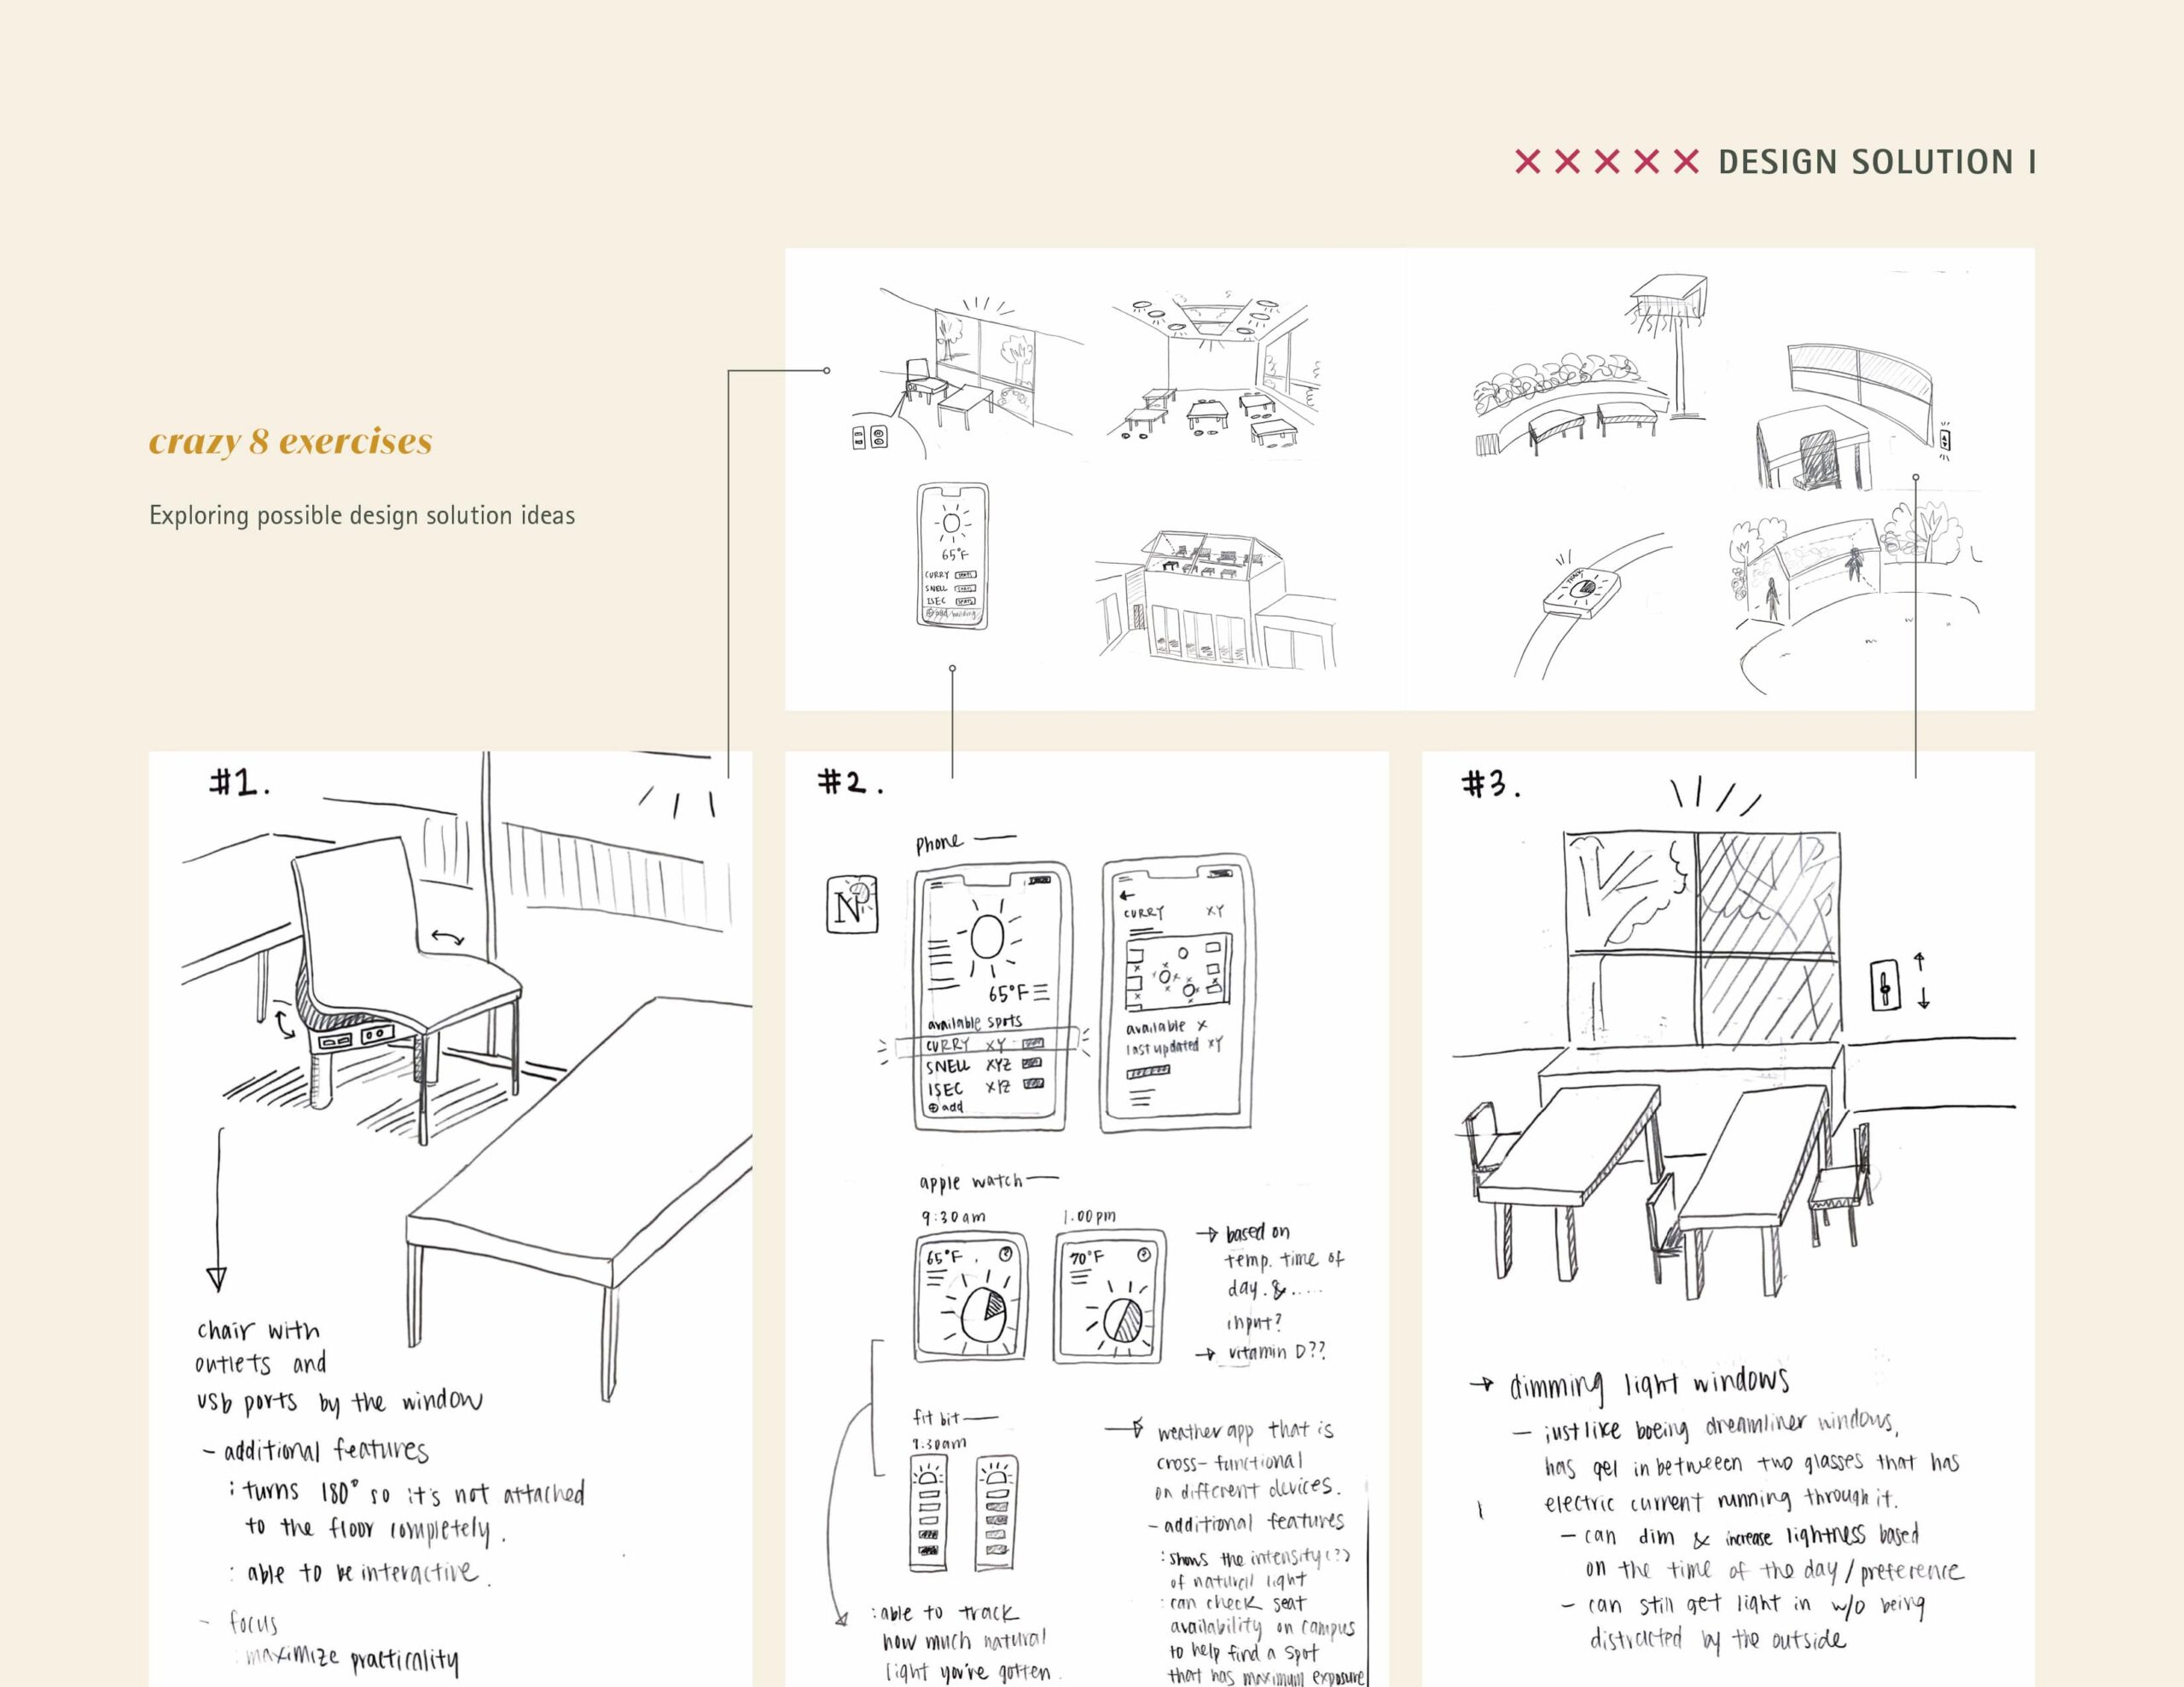
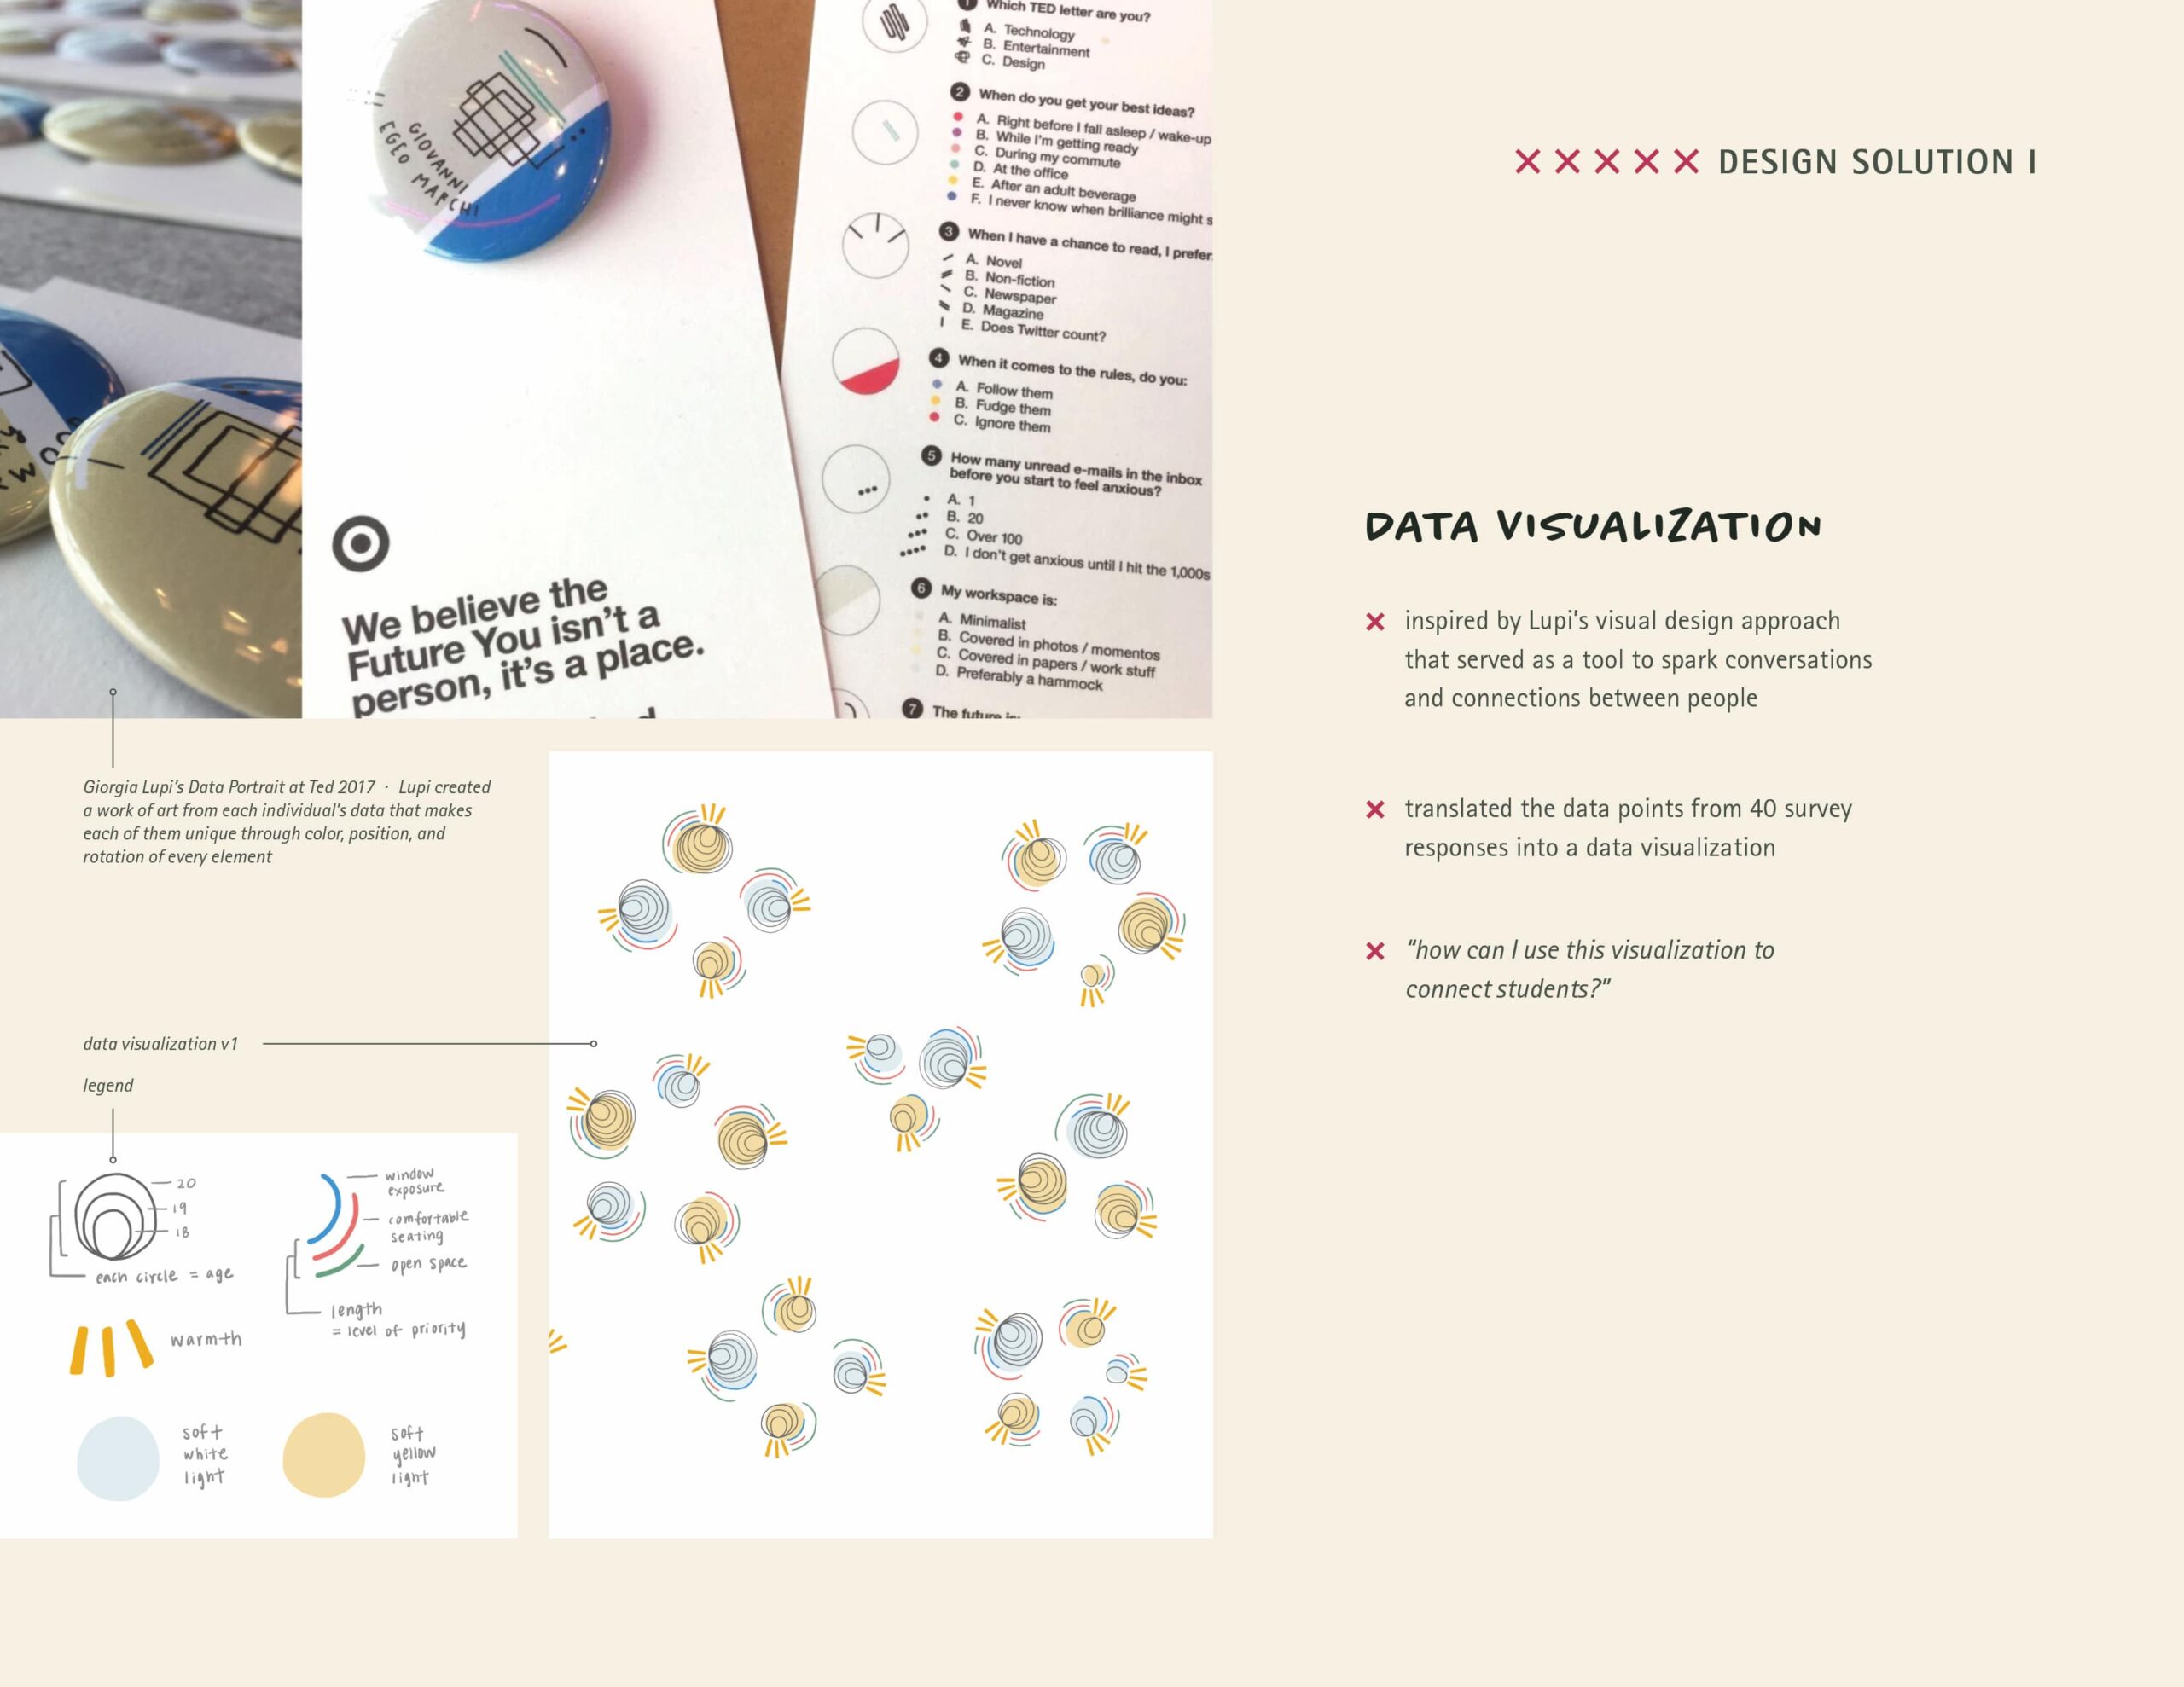
Data Visualization Exploration
I went through a couple rounds of iterations before settling with a more refined and simplified version.
v1: Legend + Composition
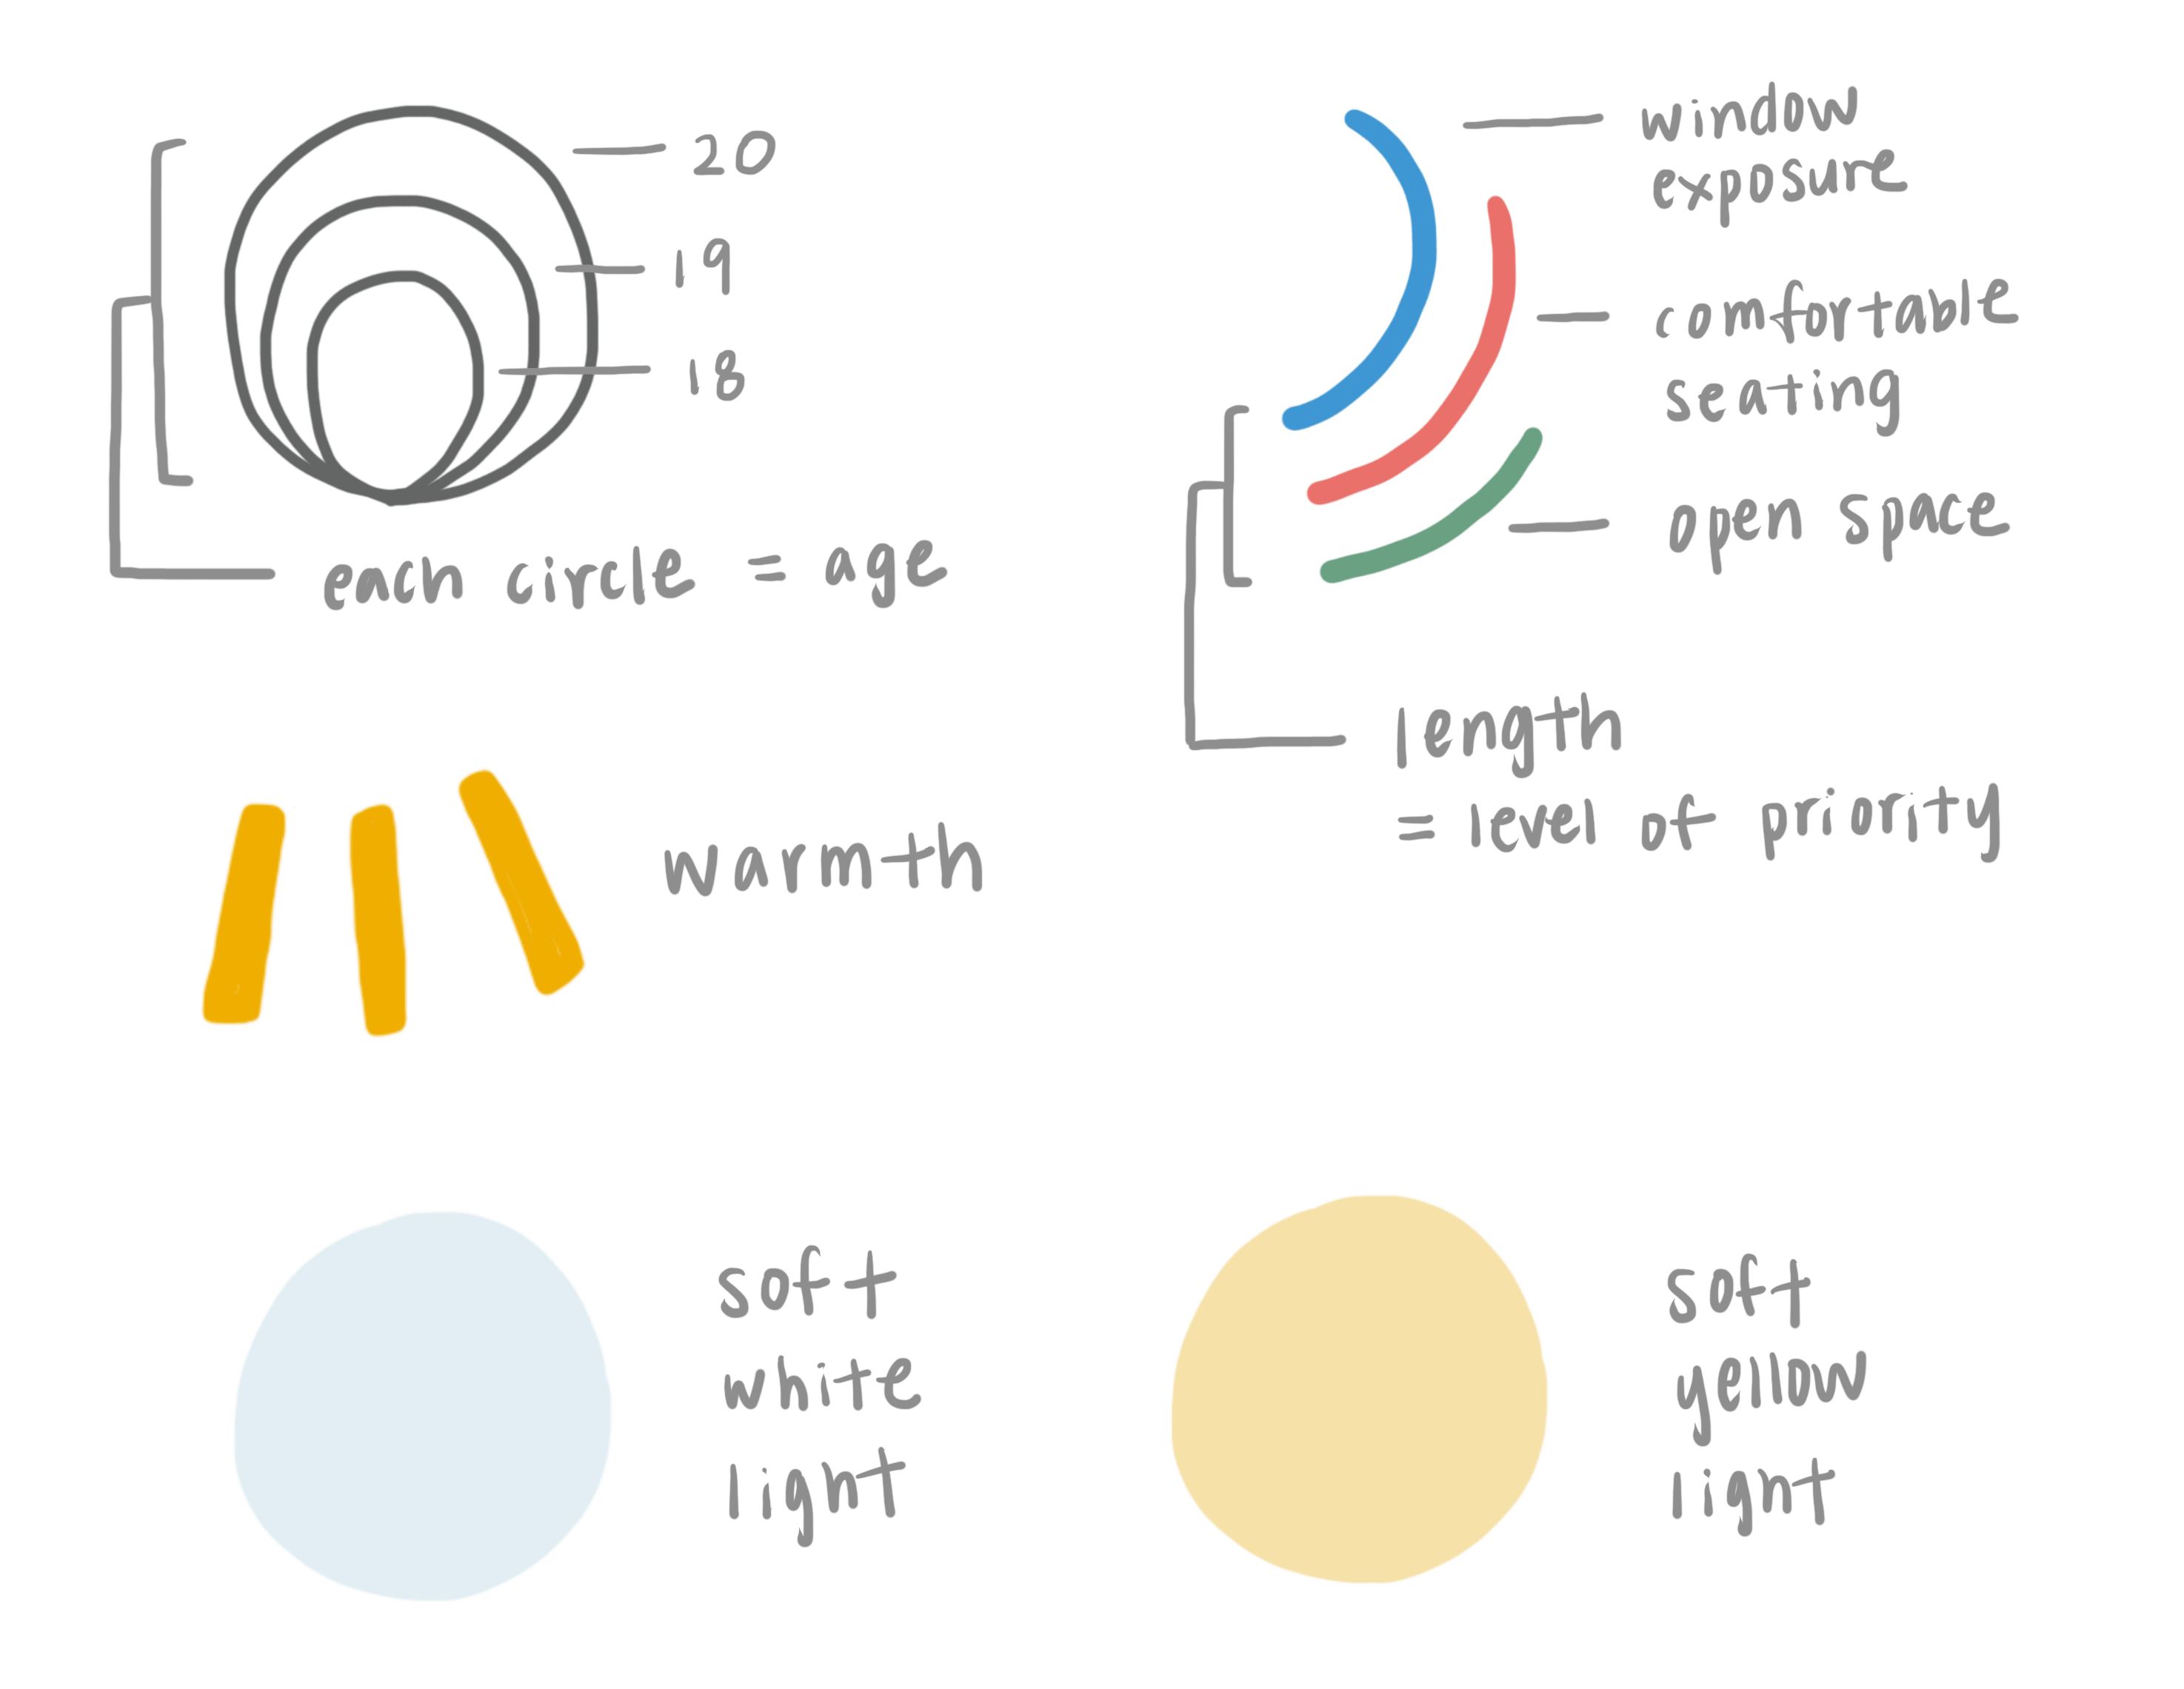
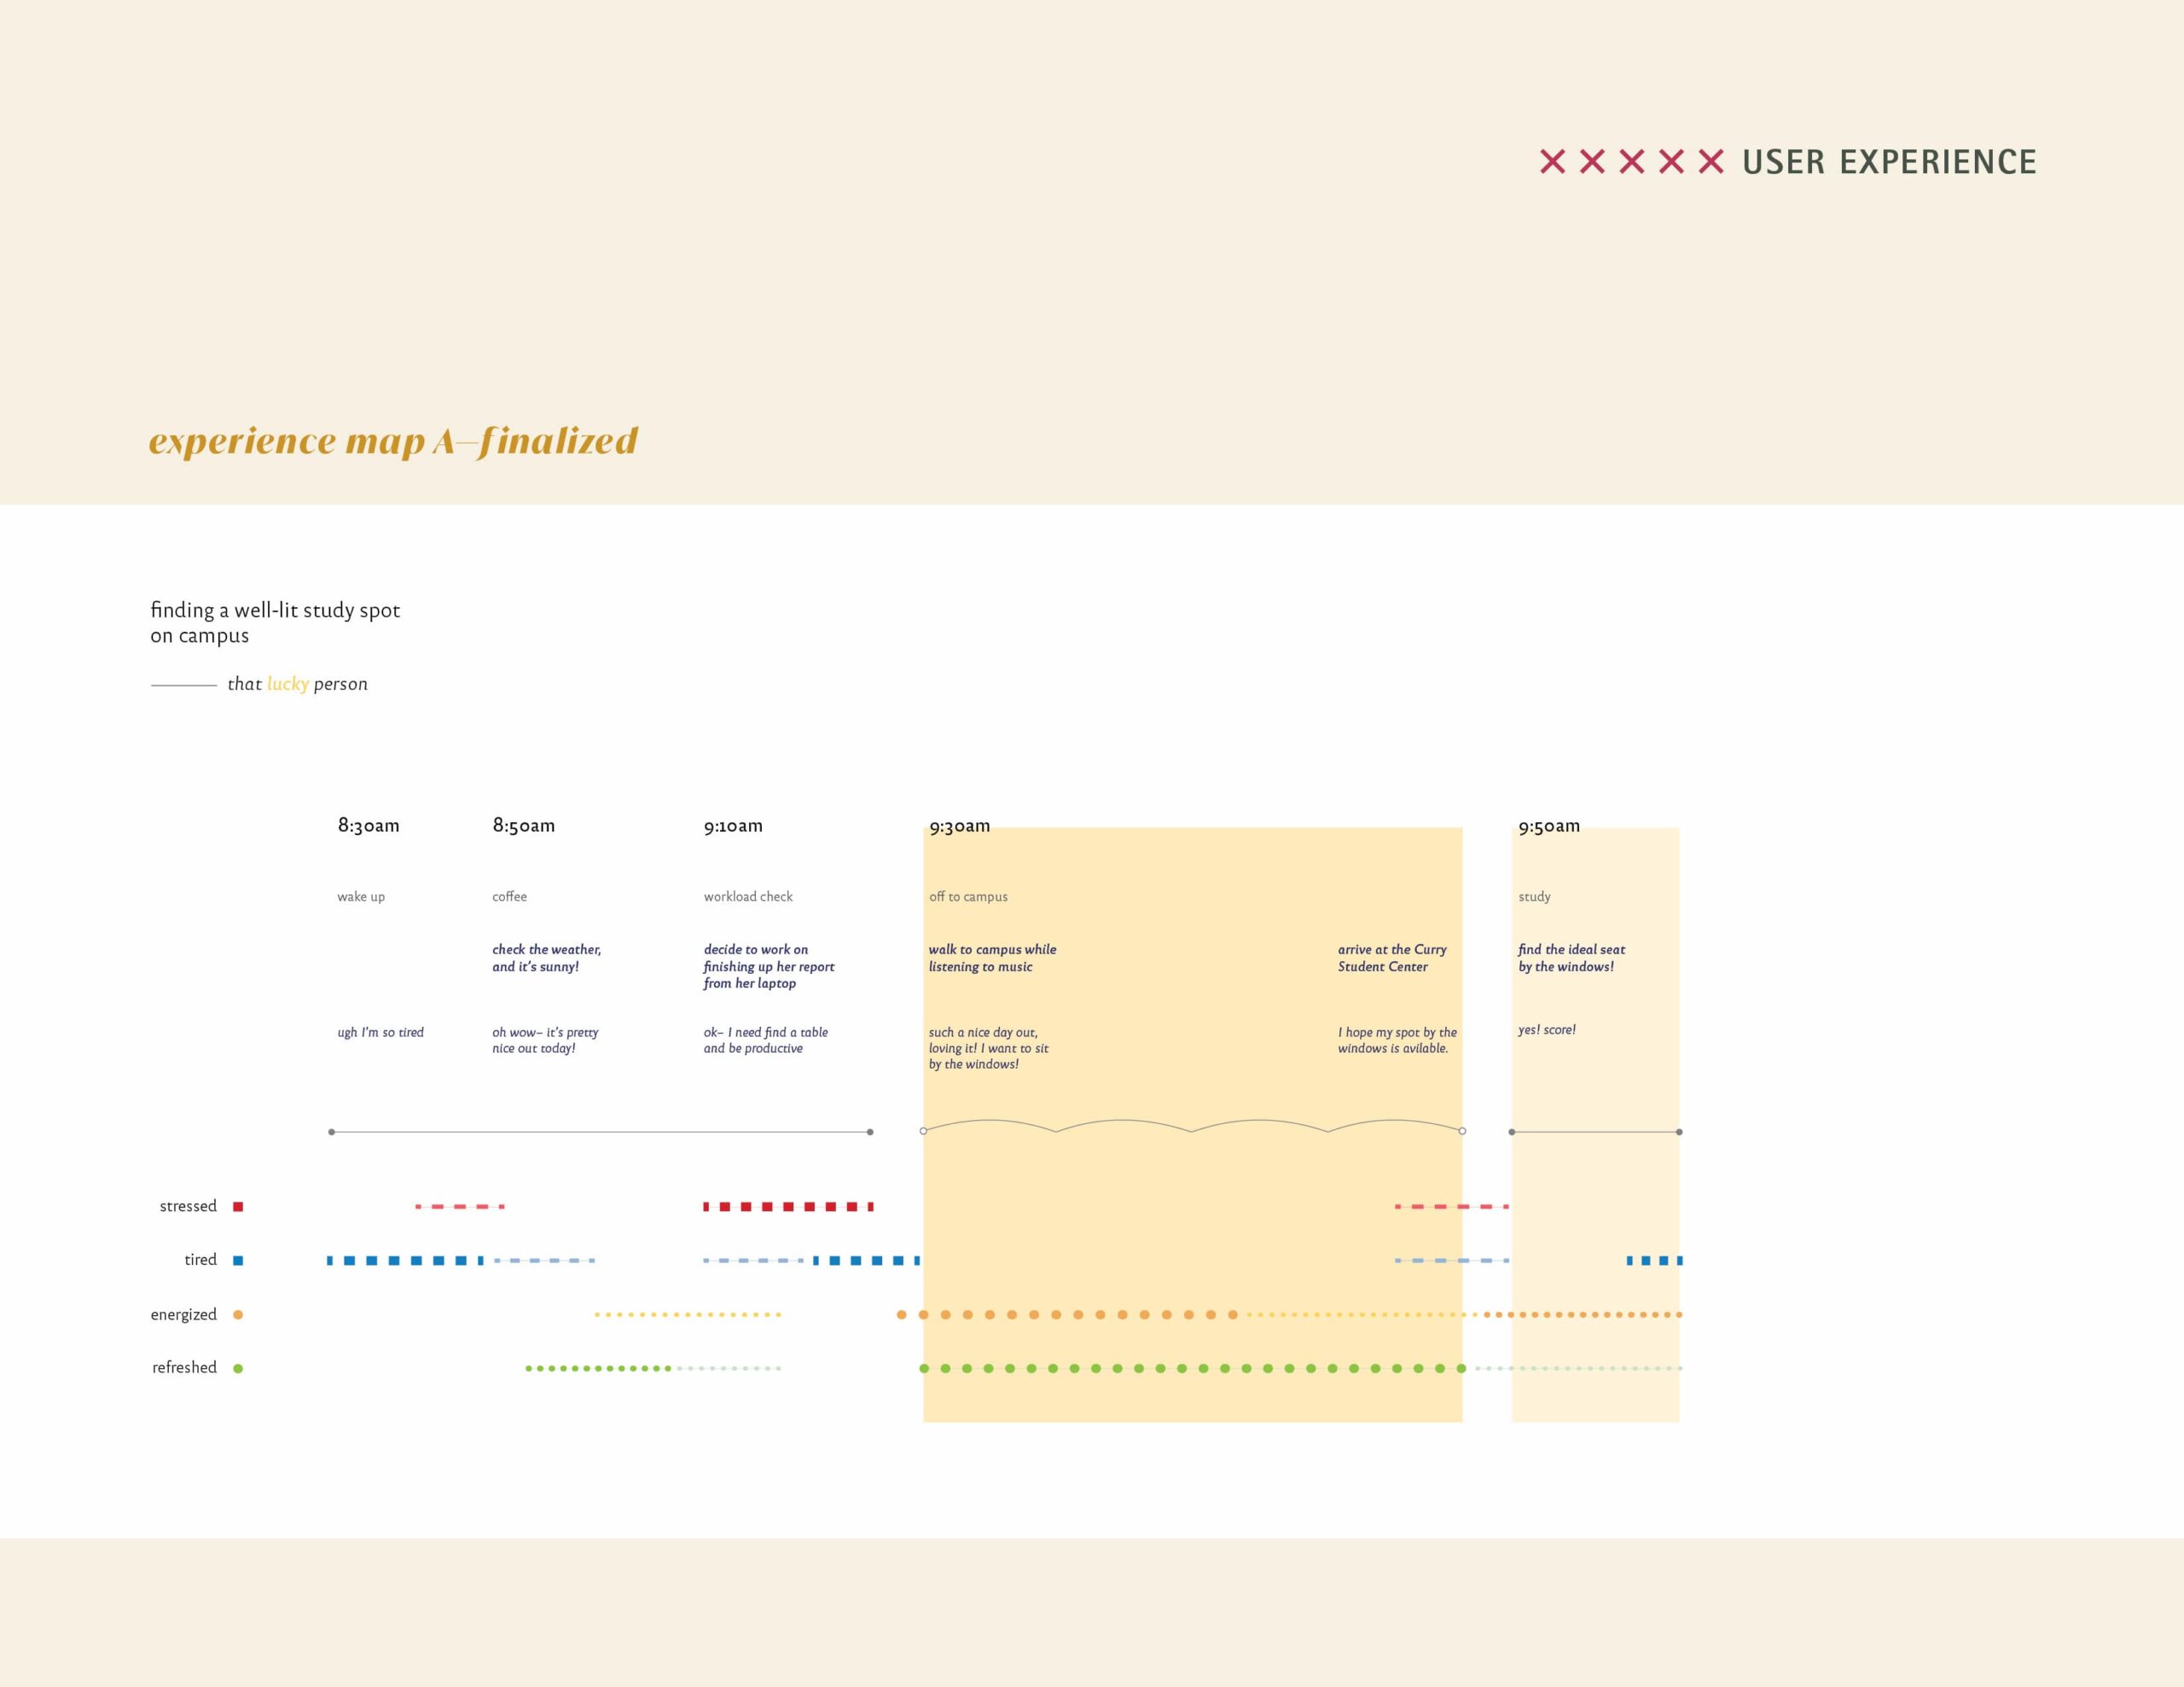
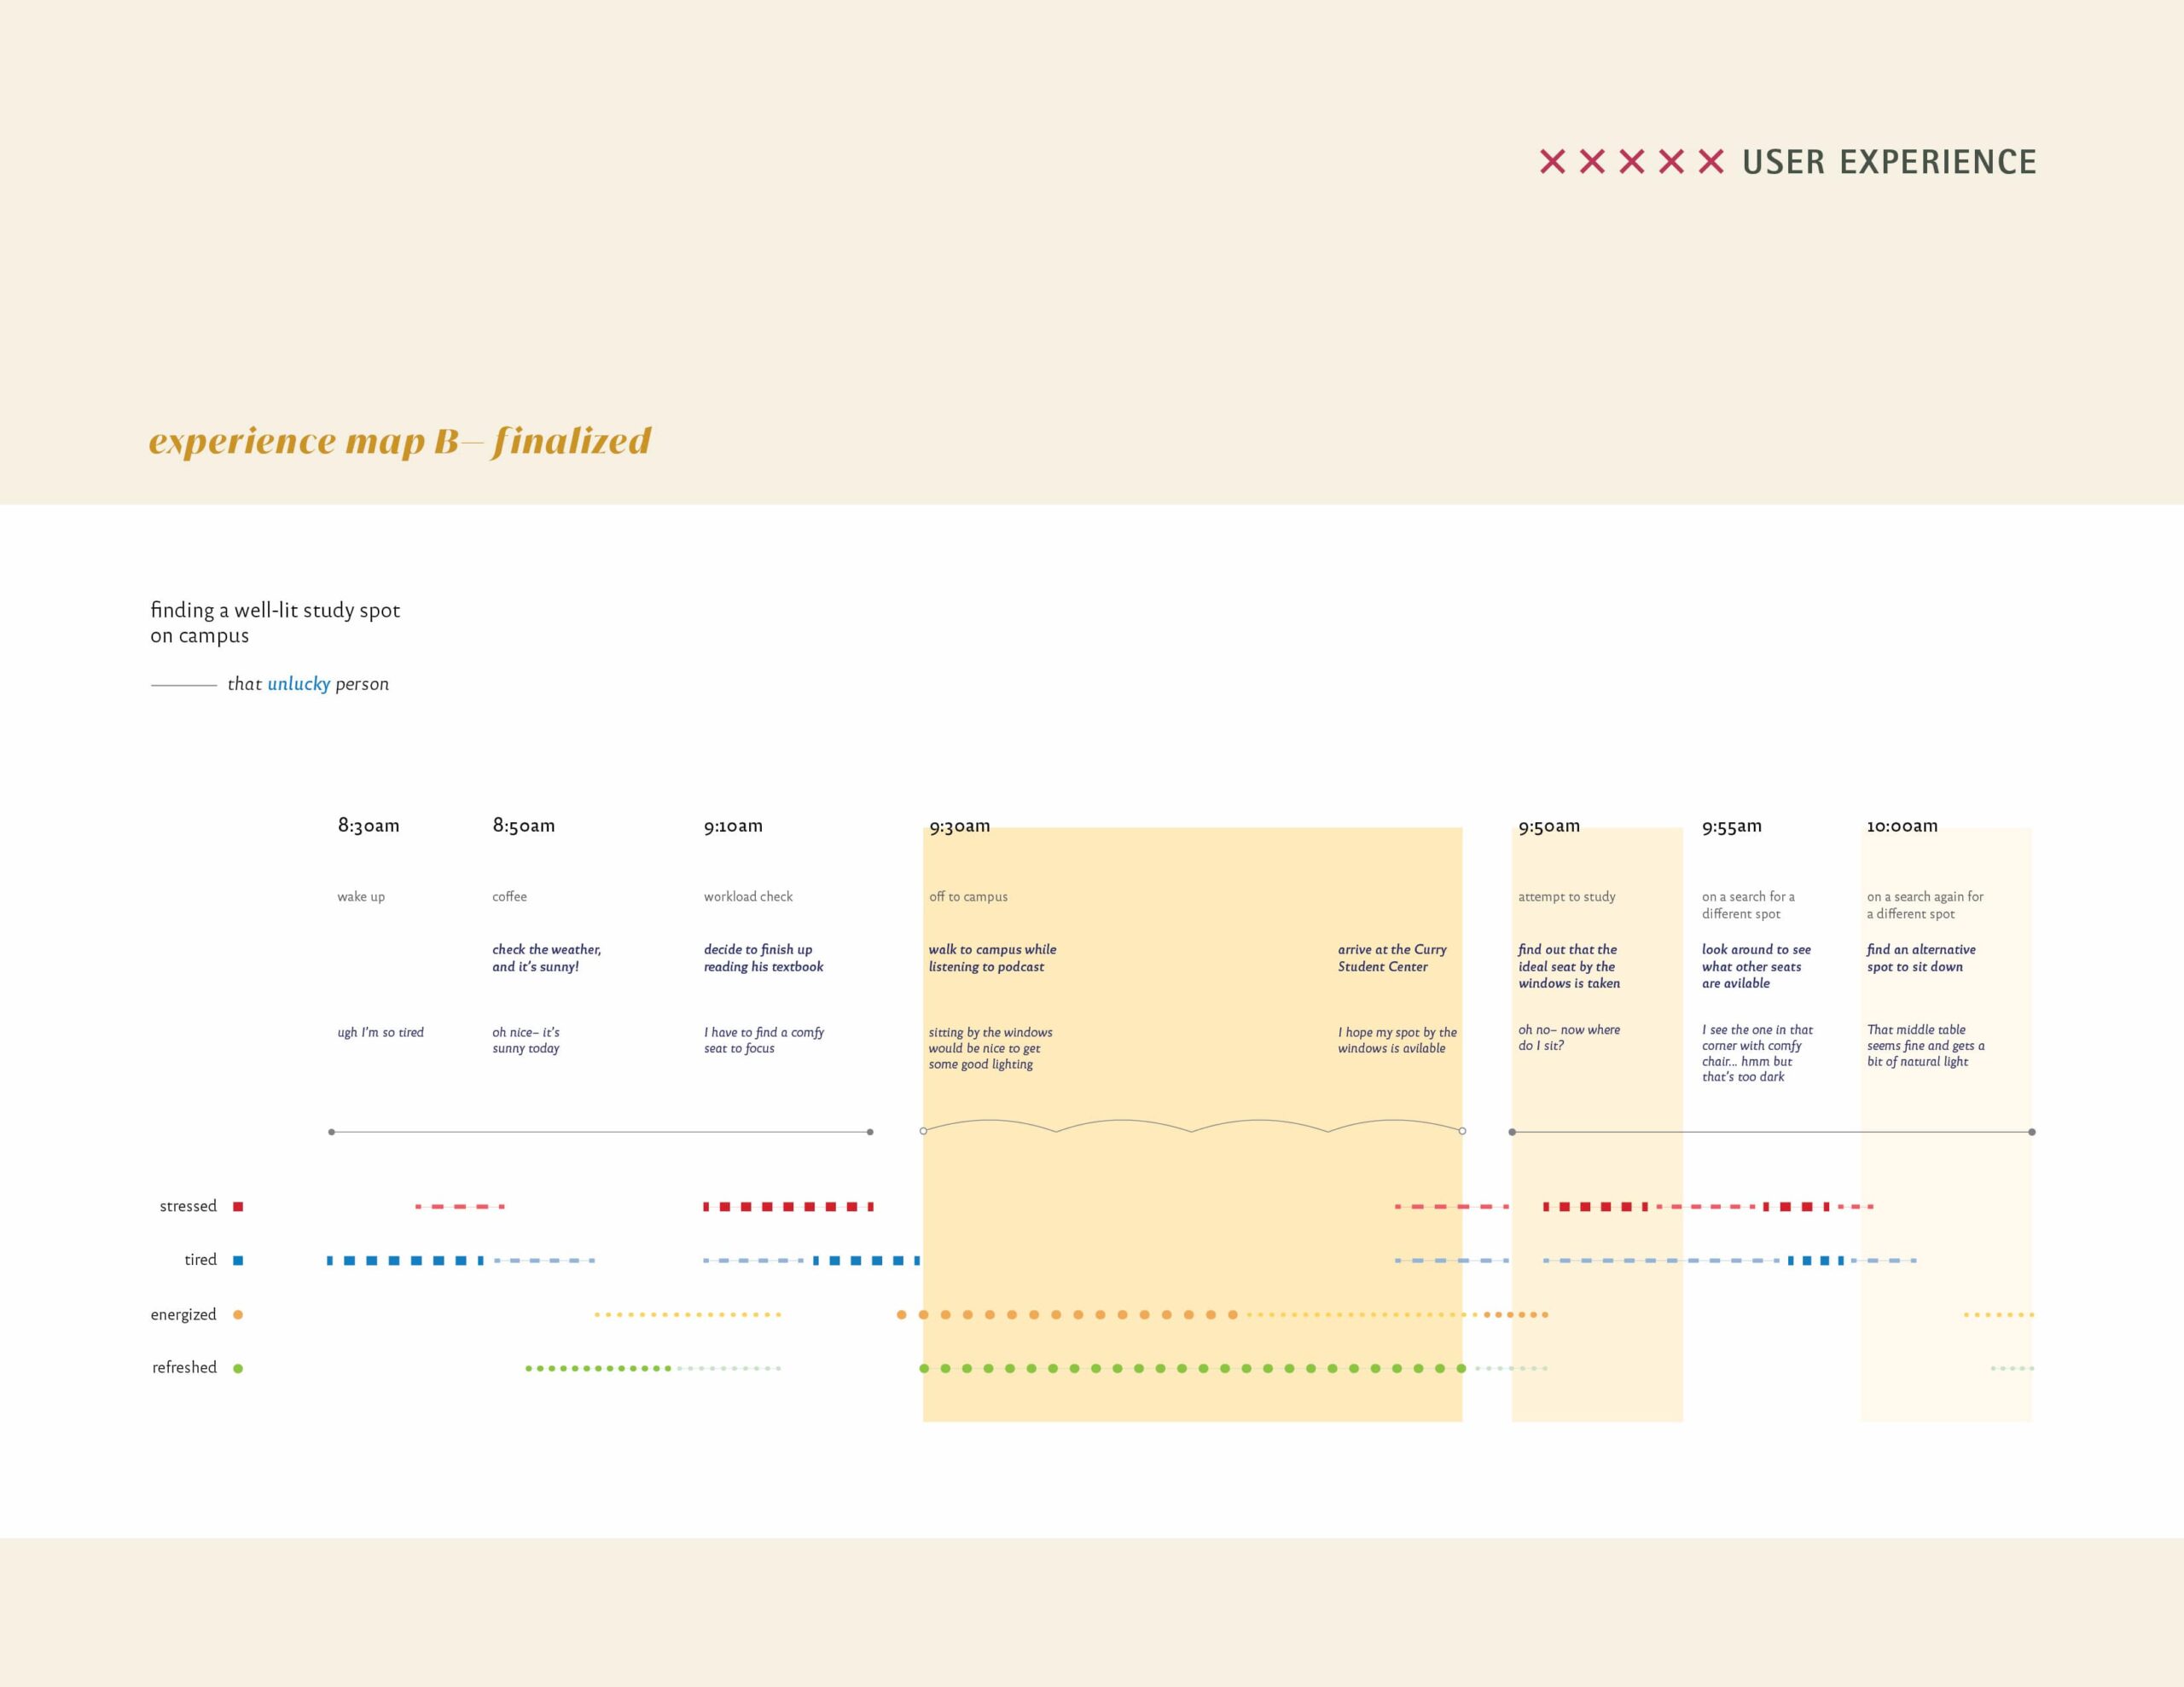
Final: Legend + Composition
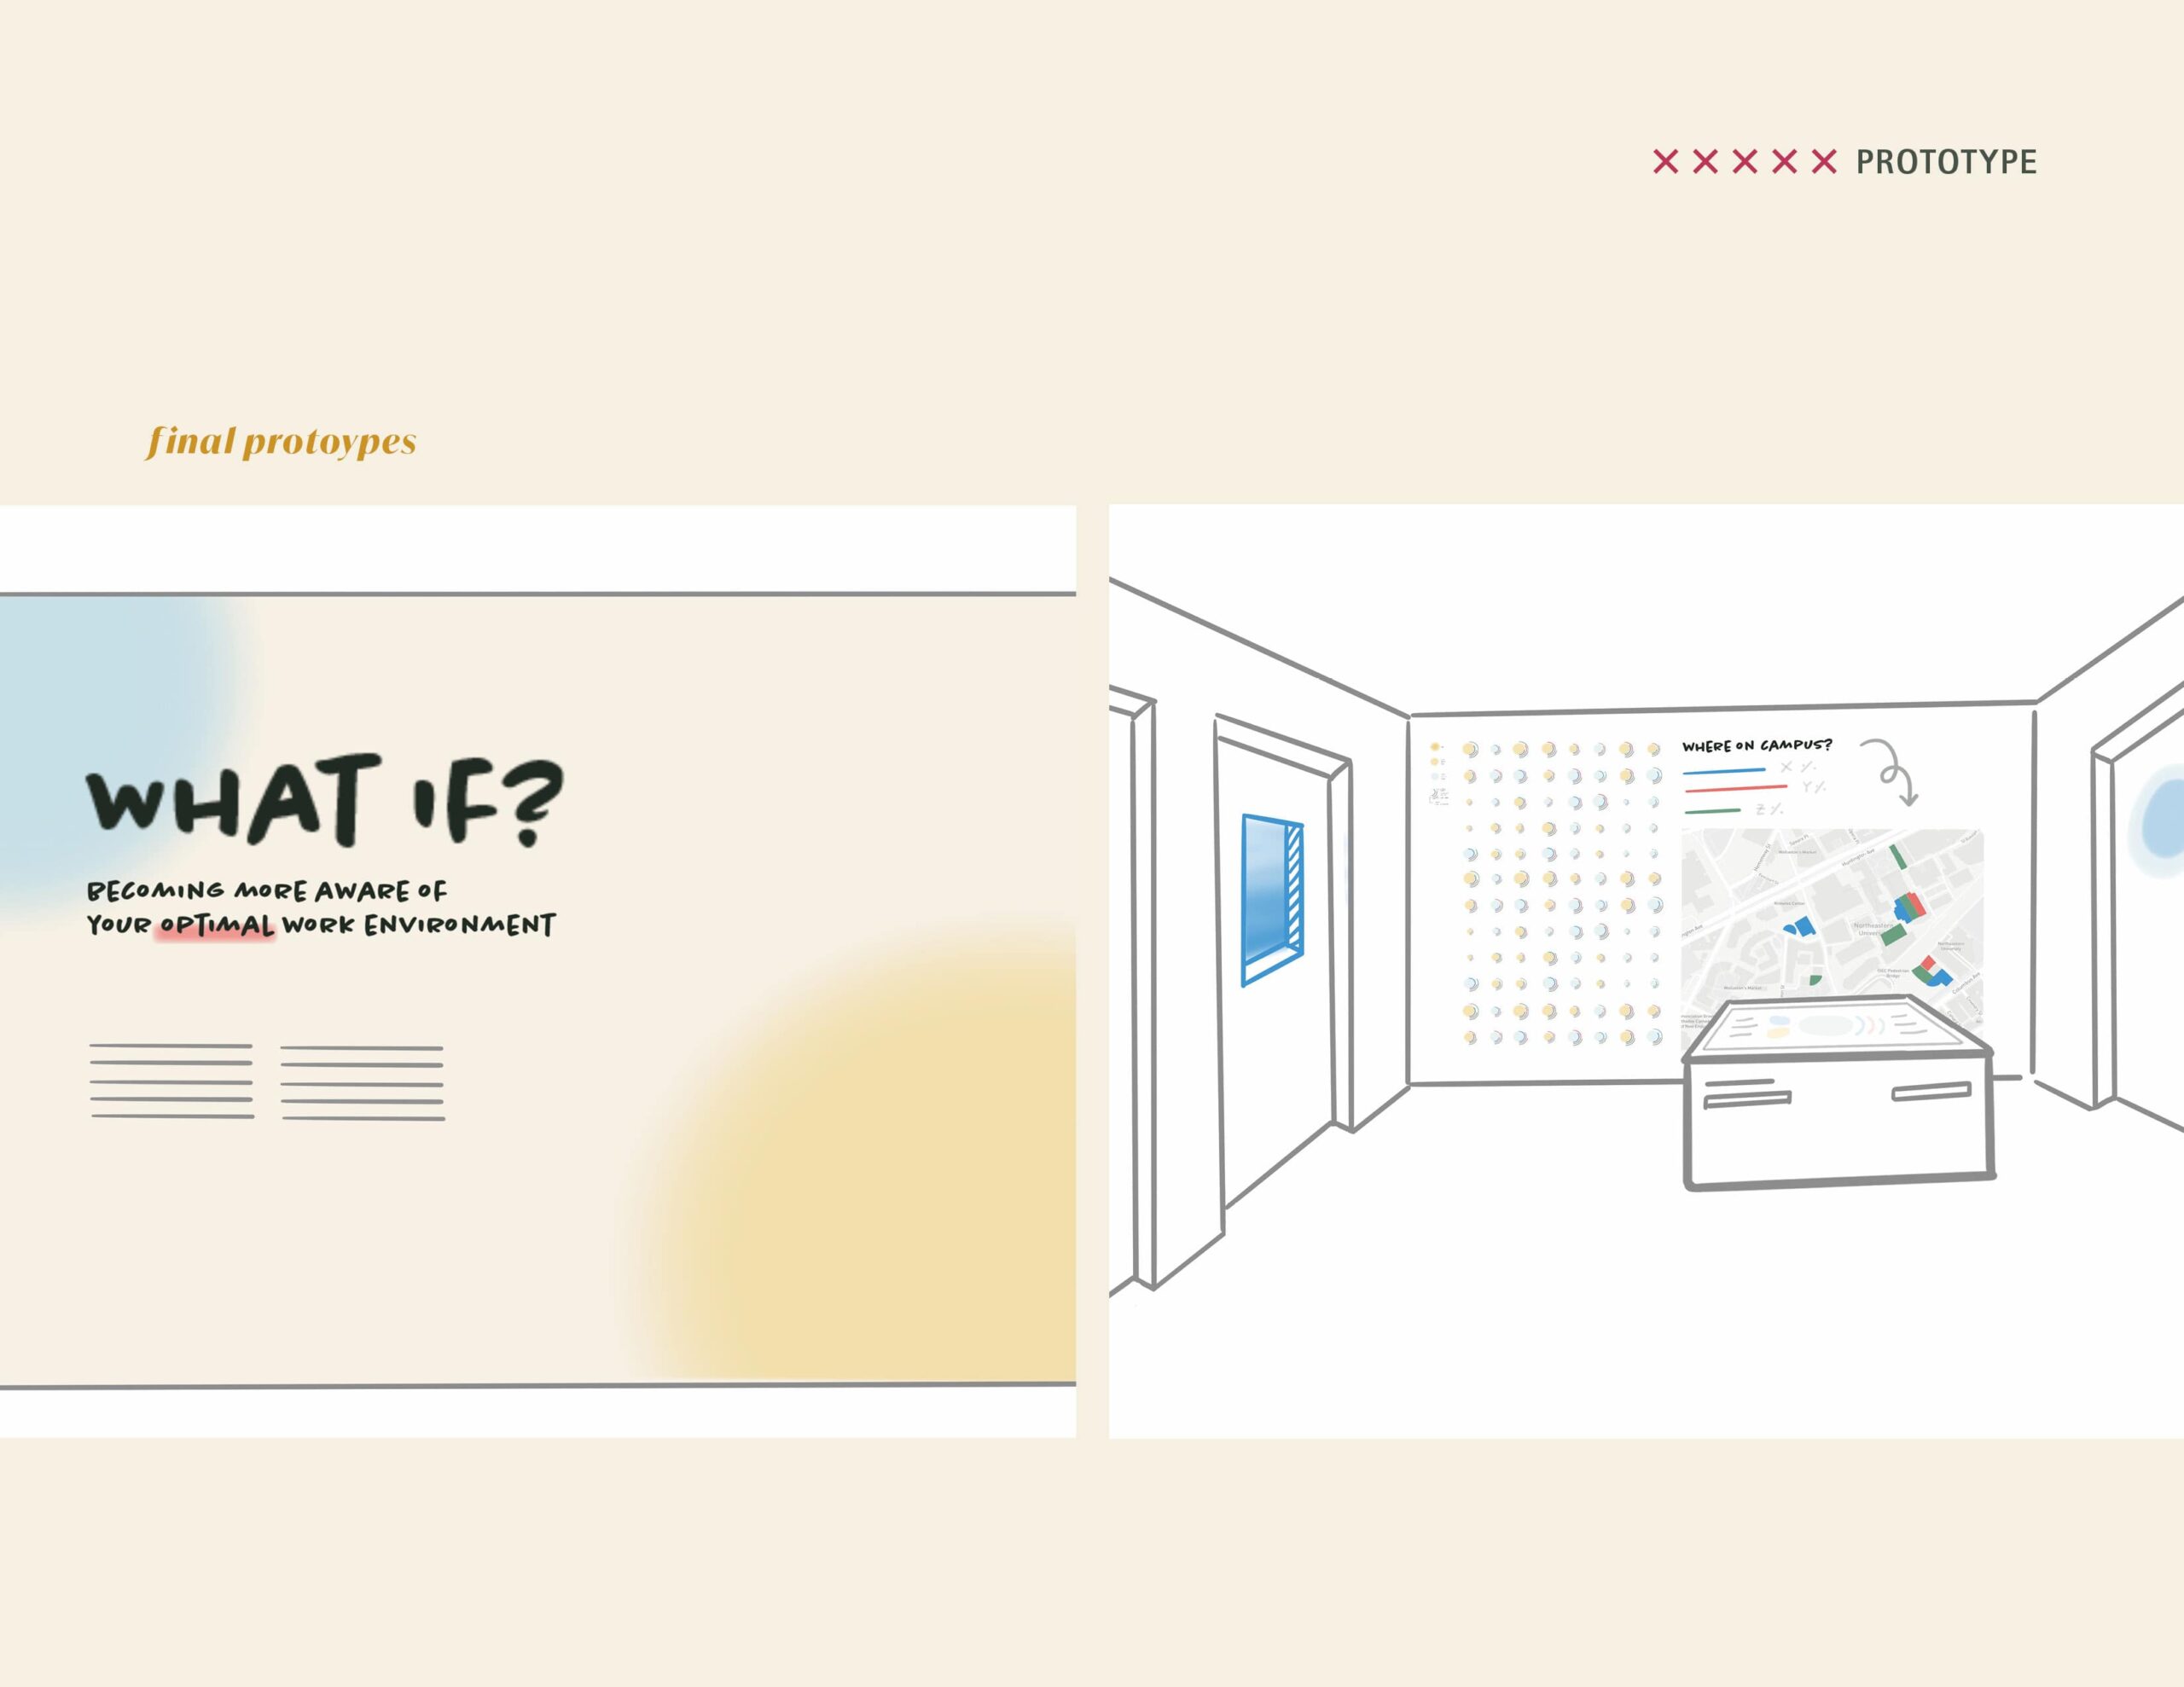
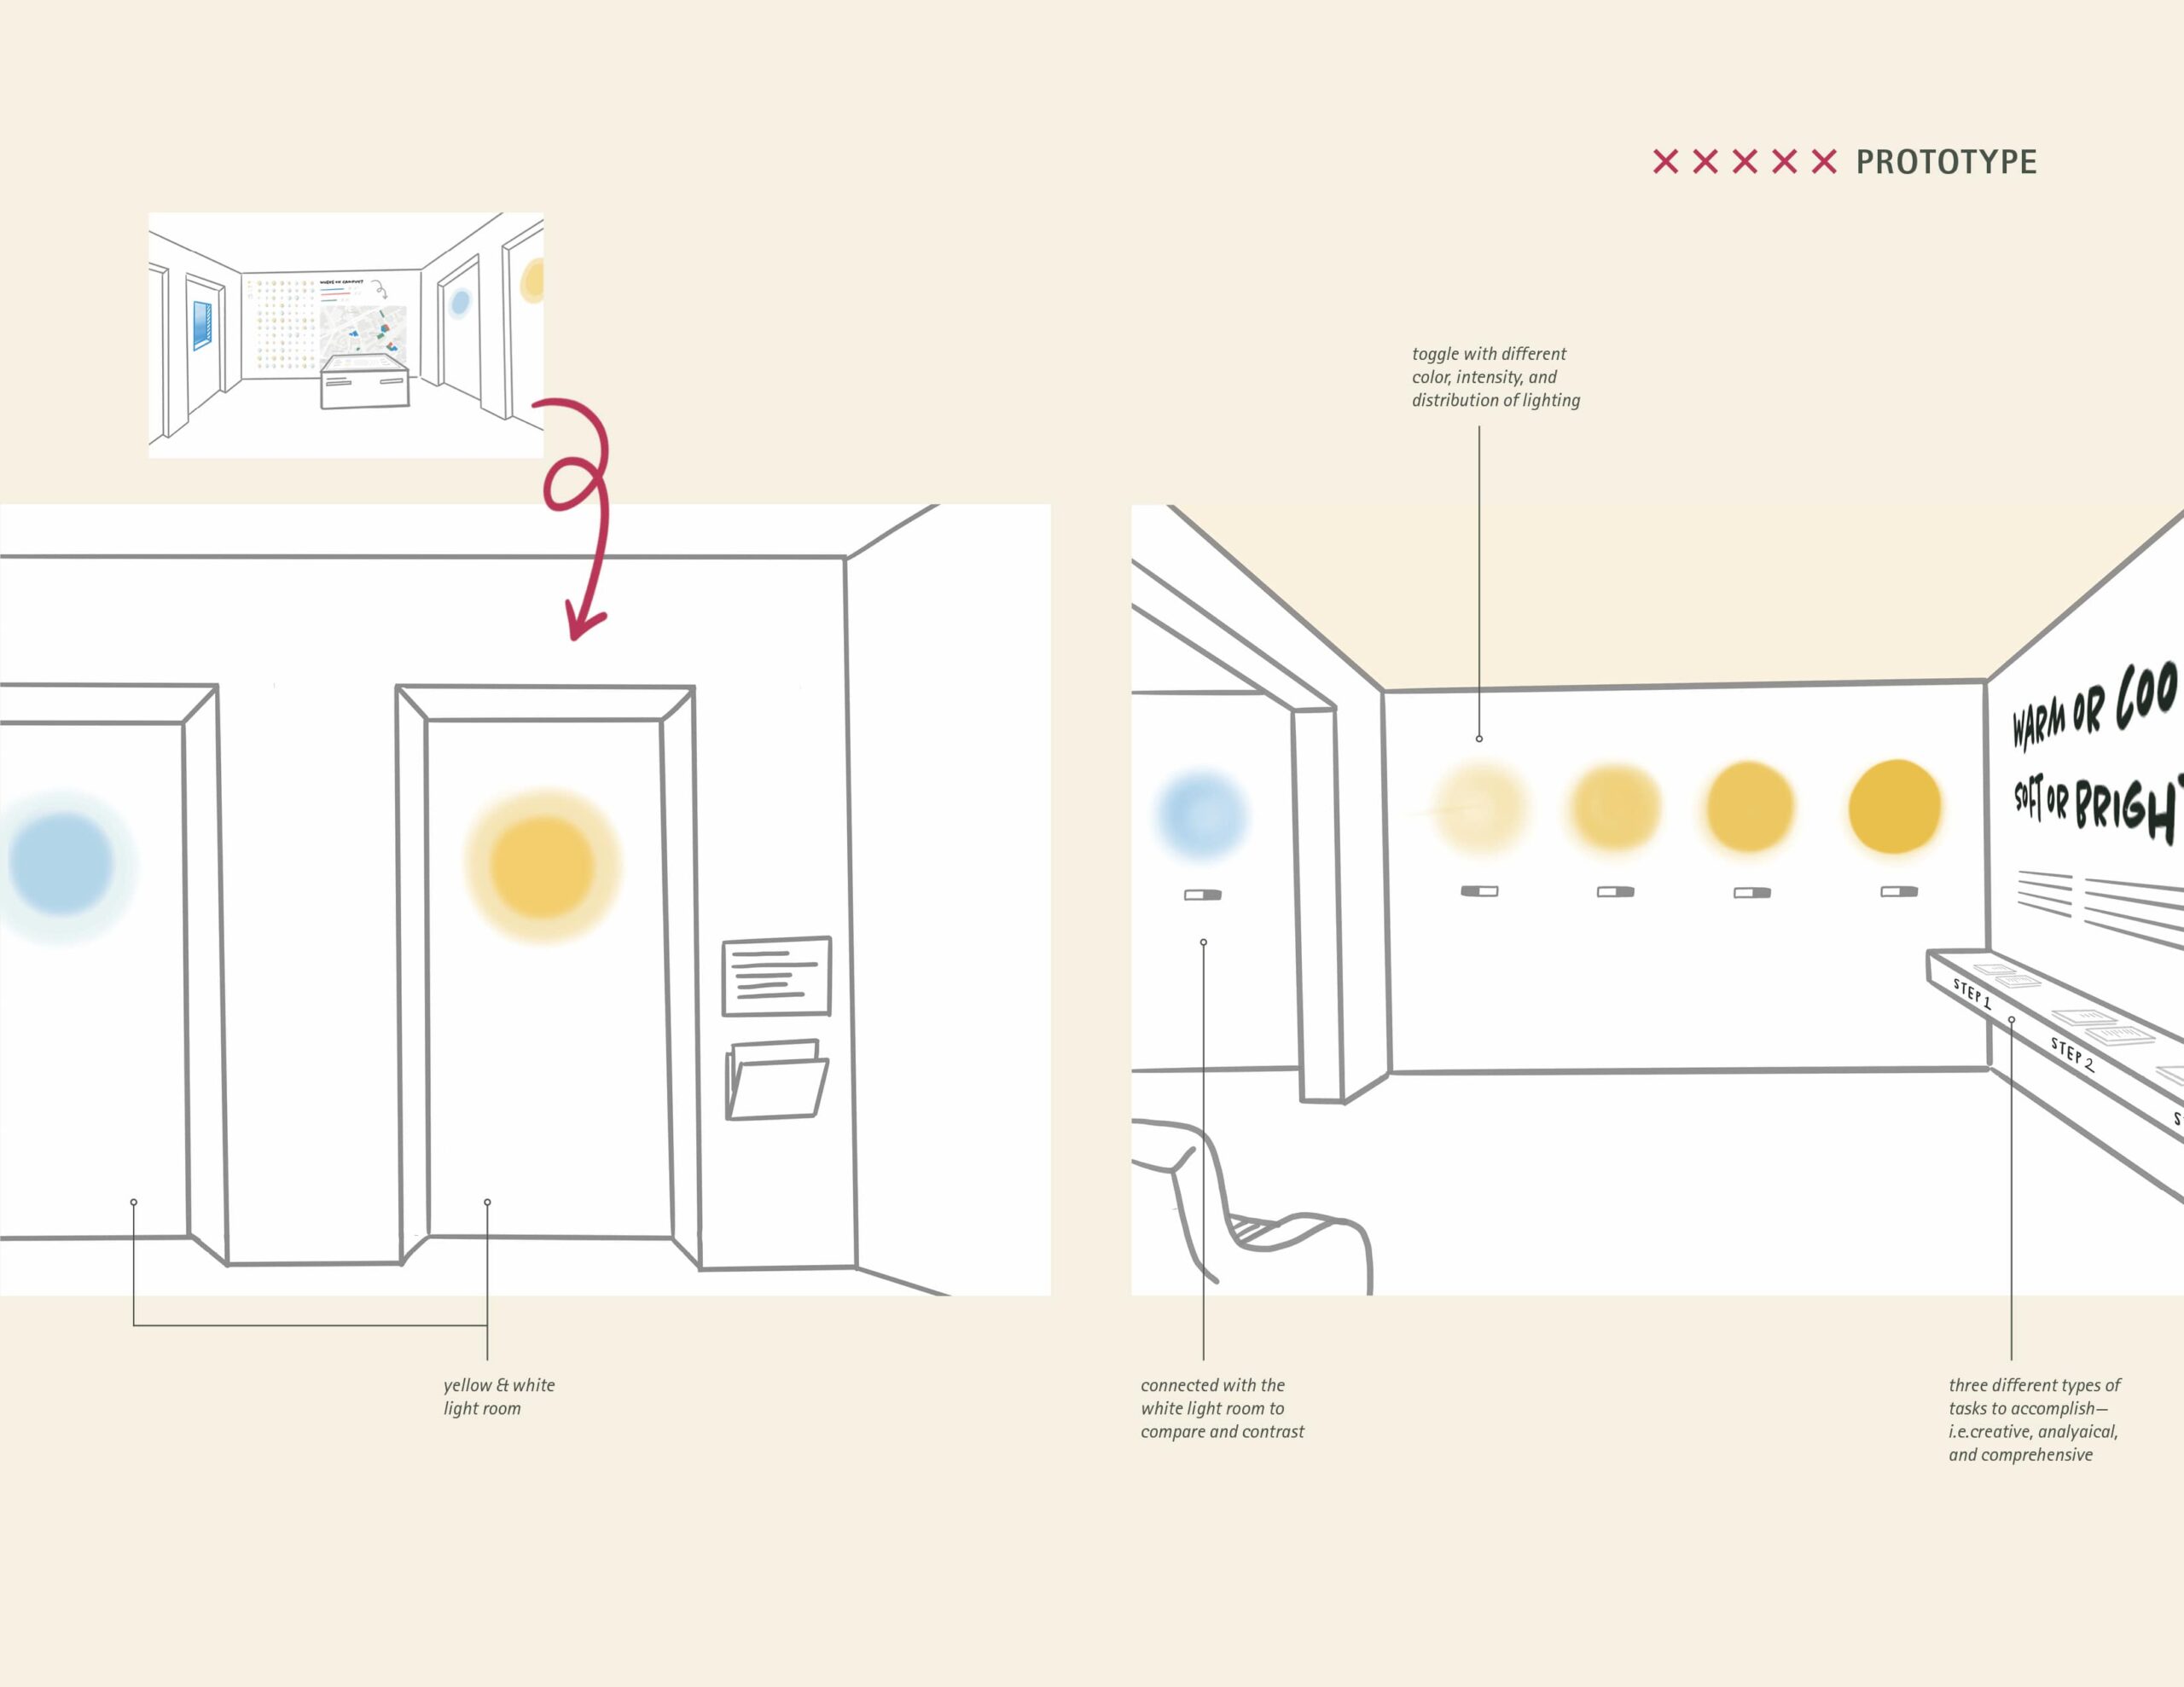
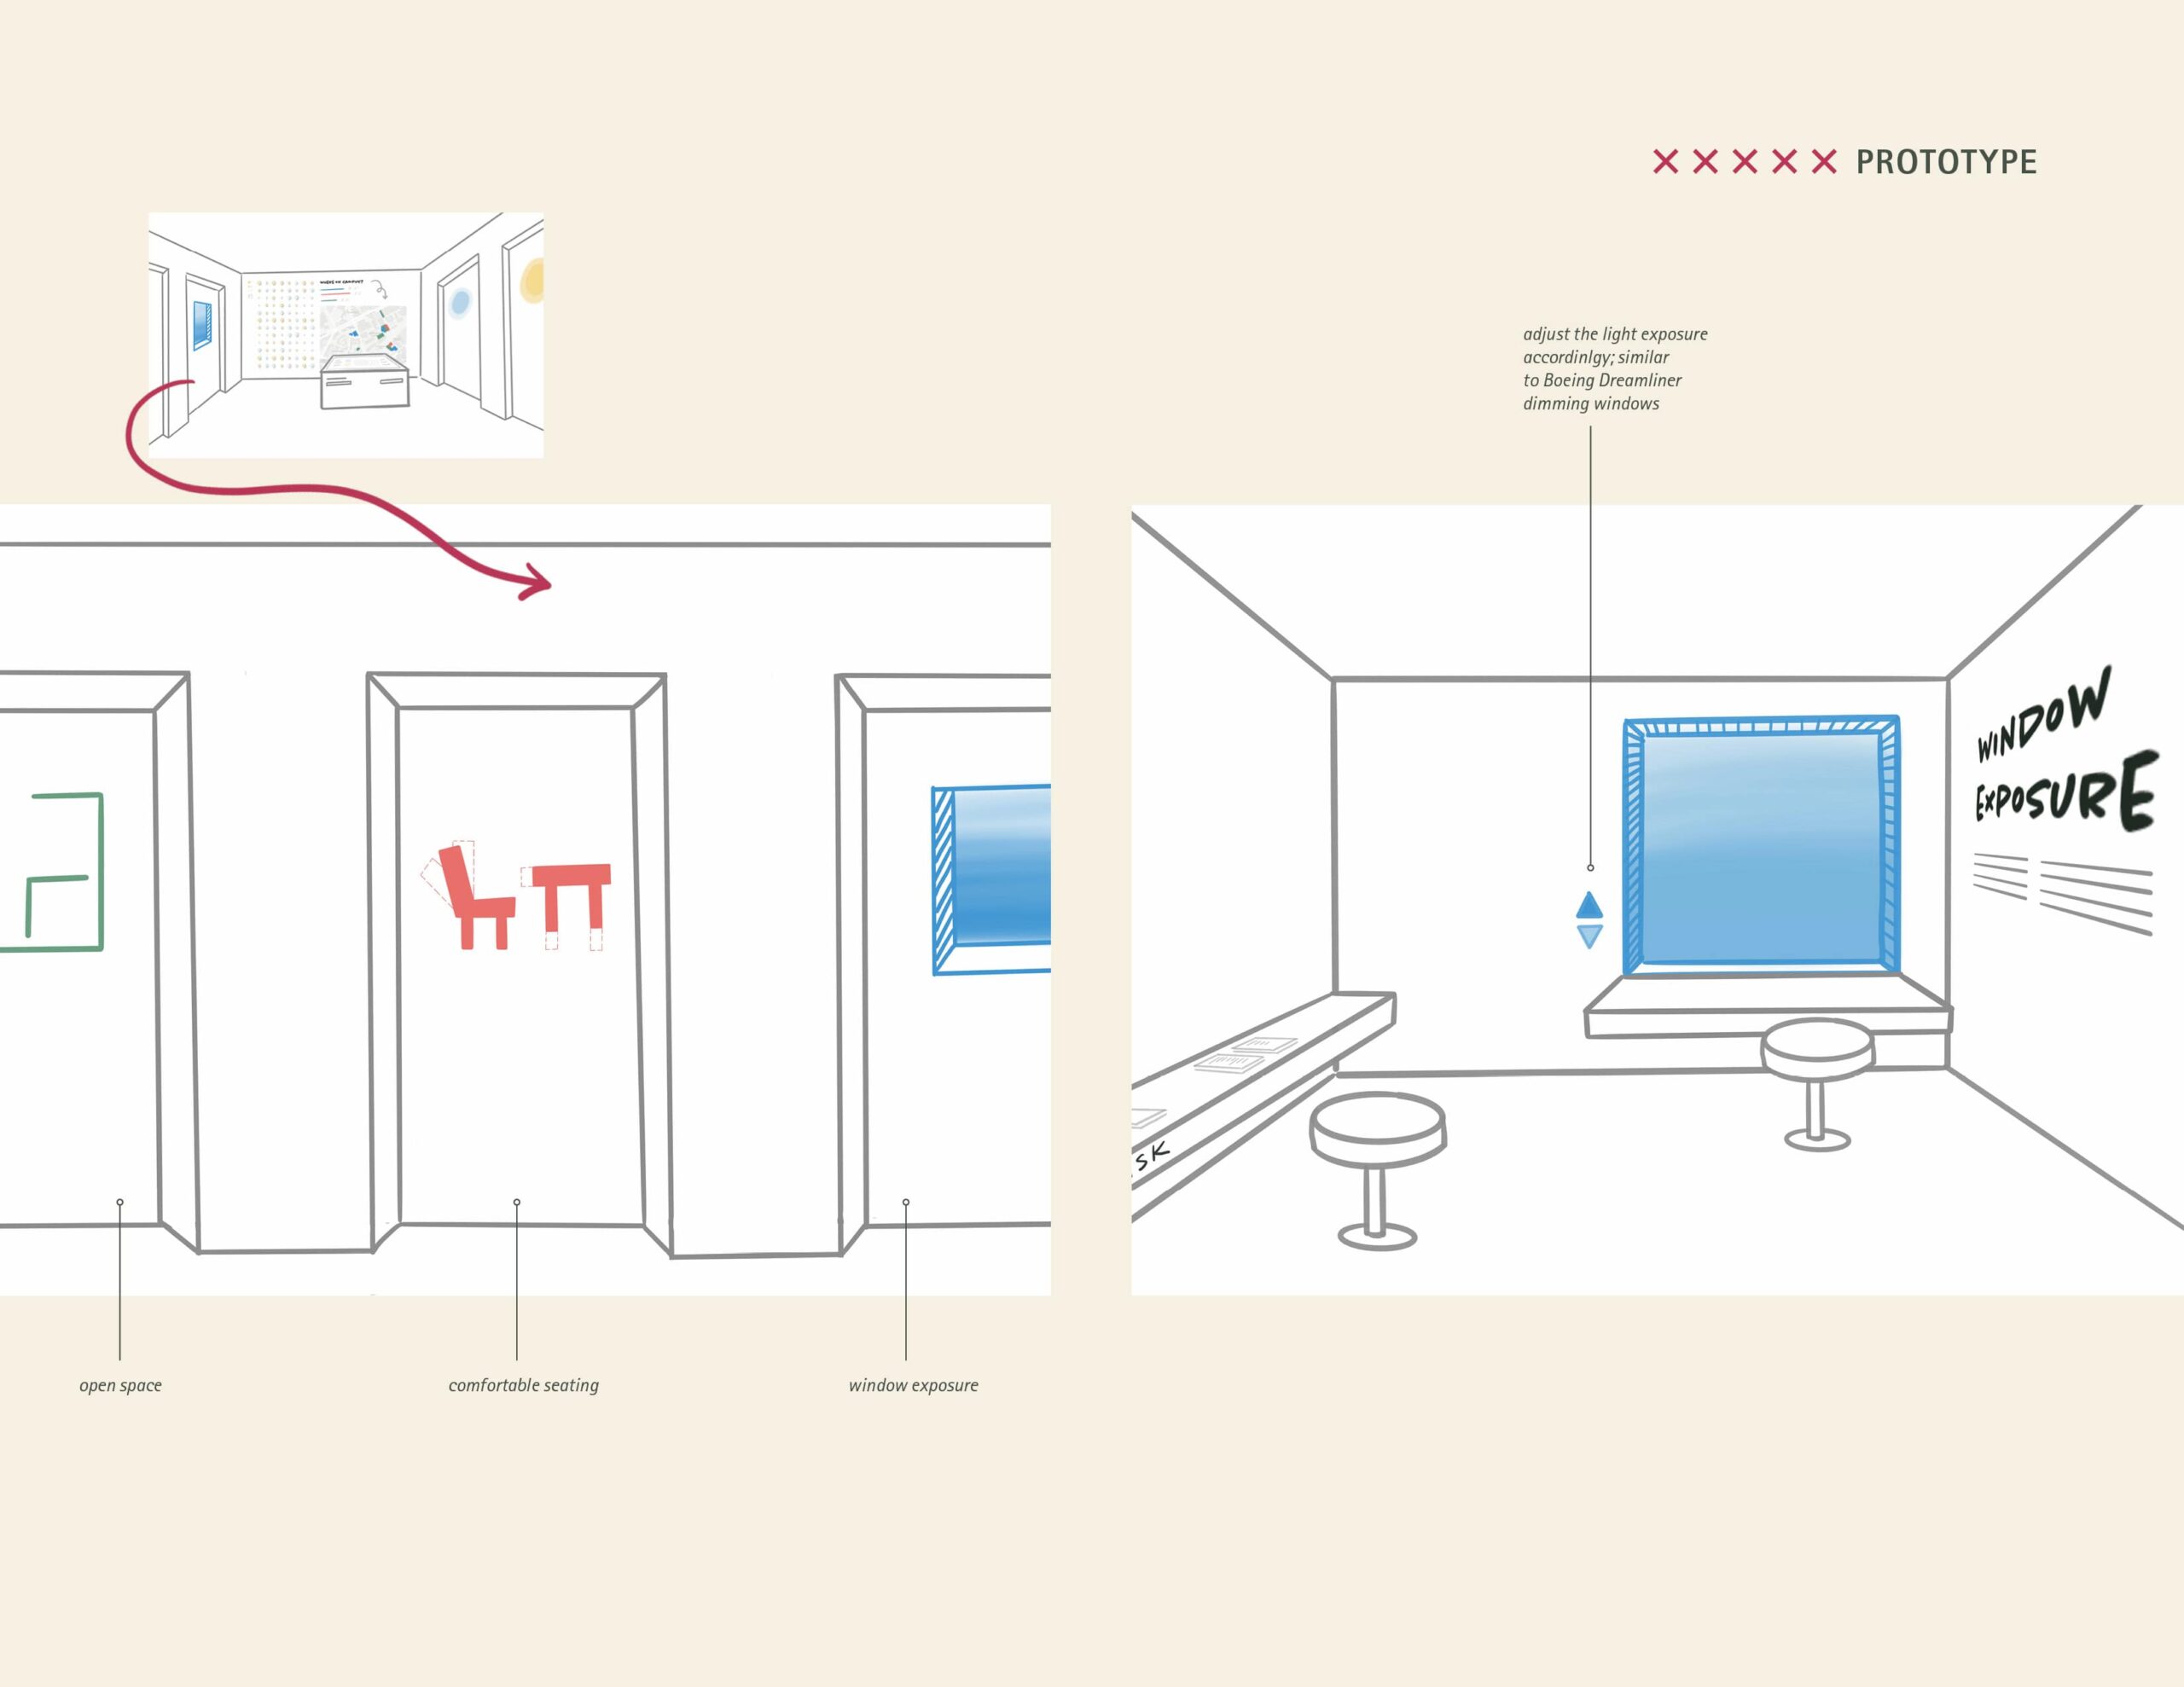
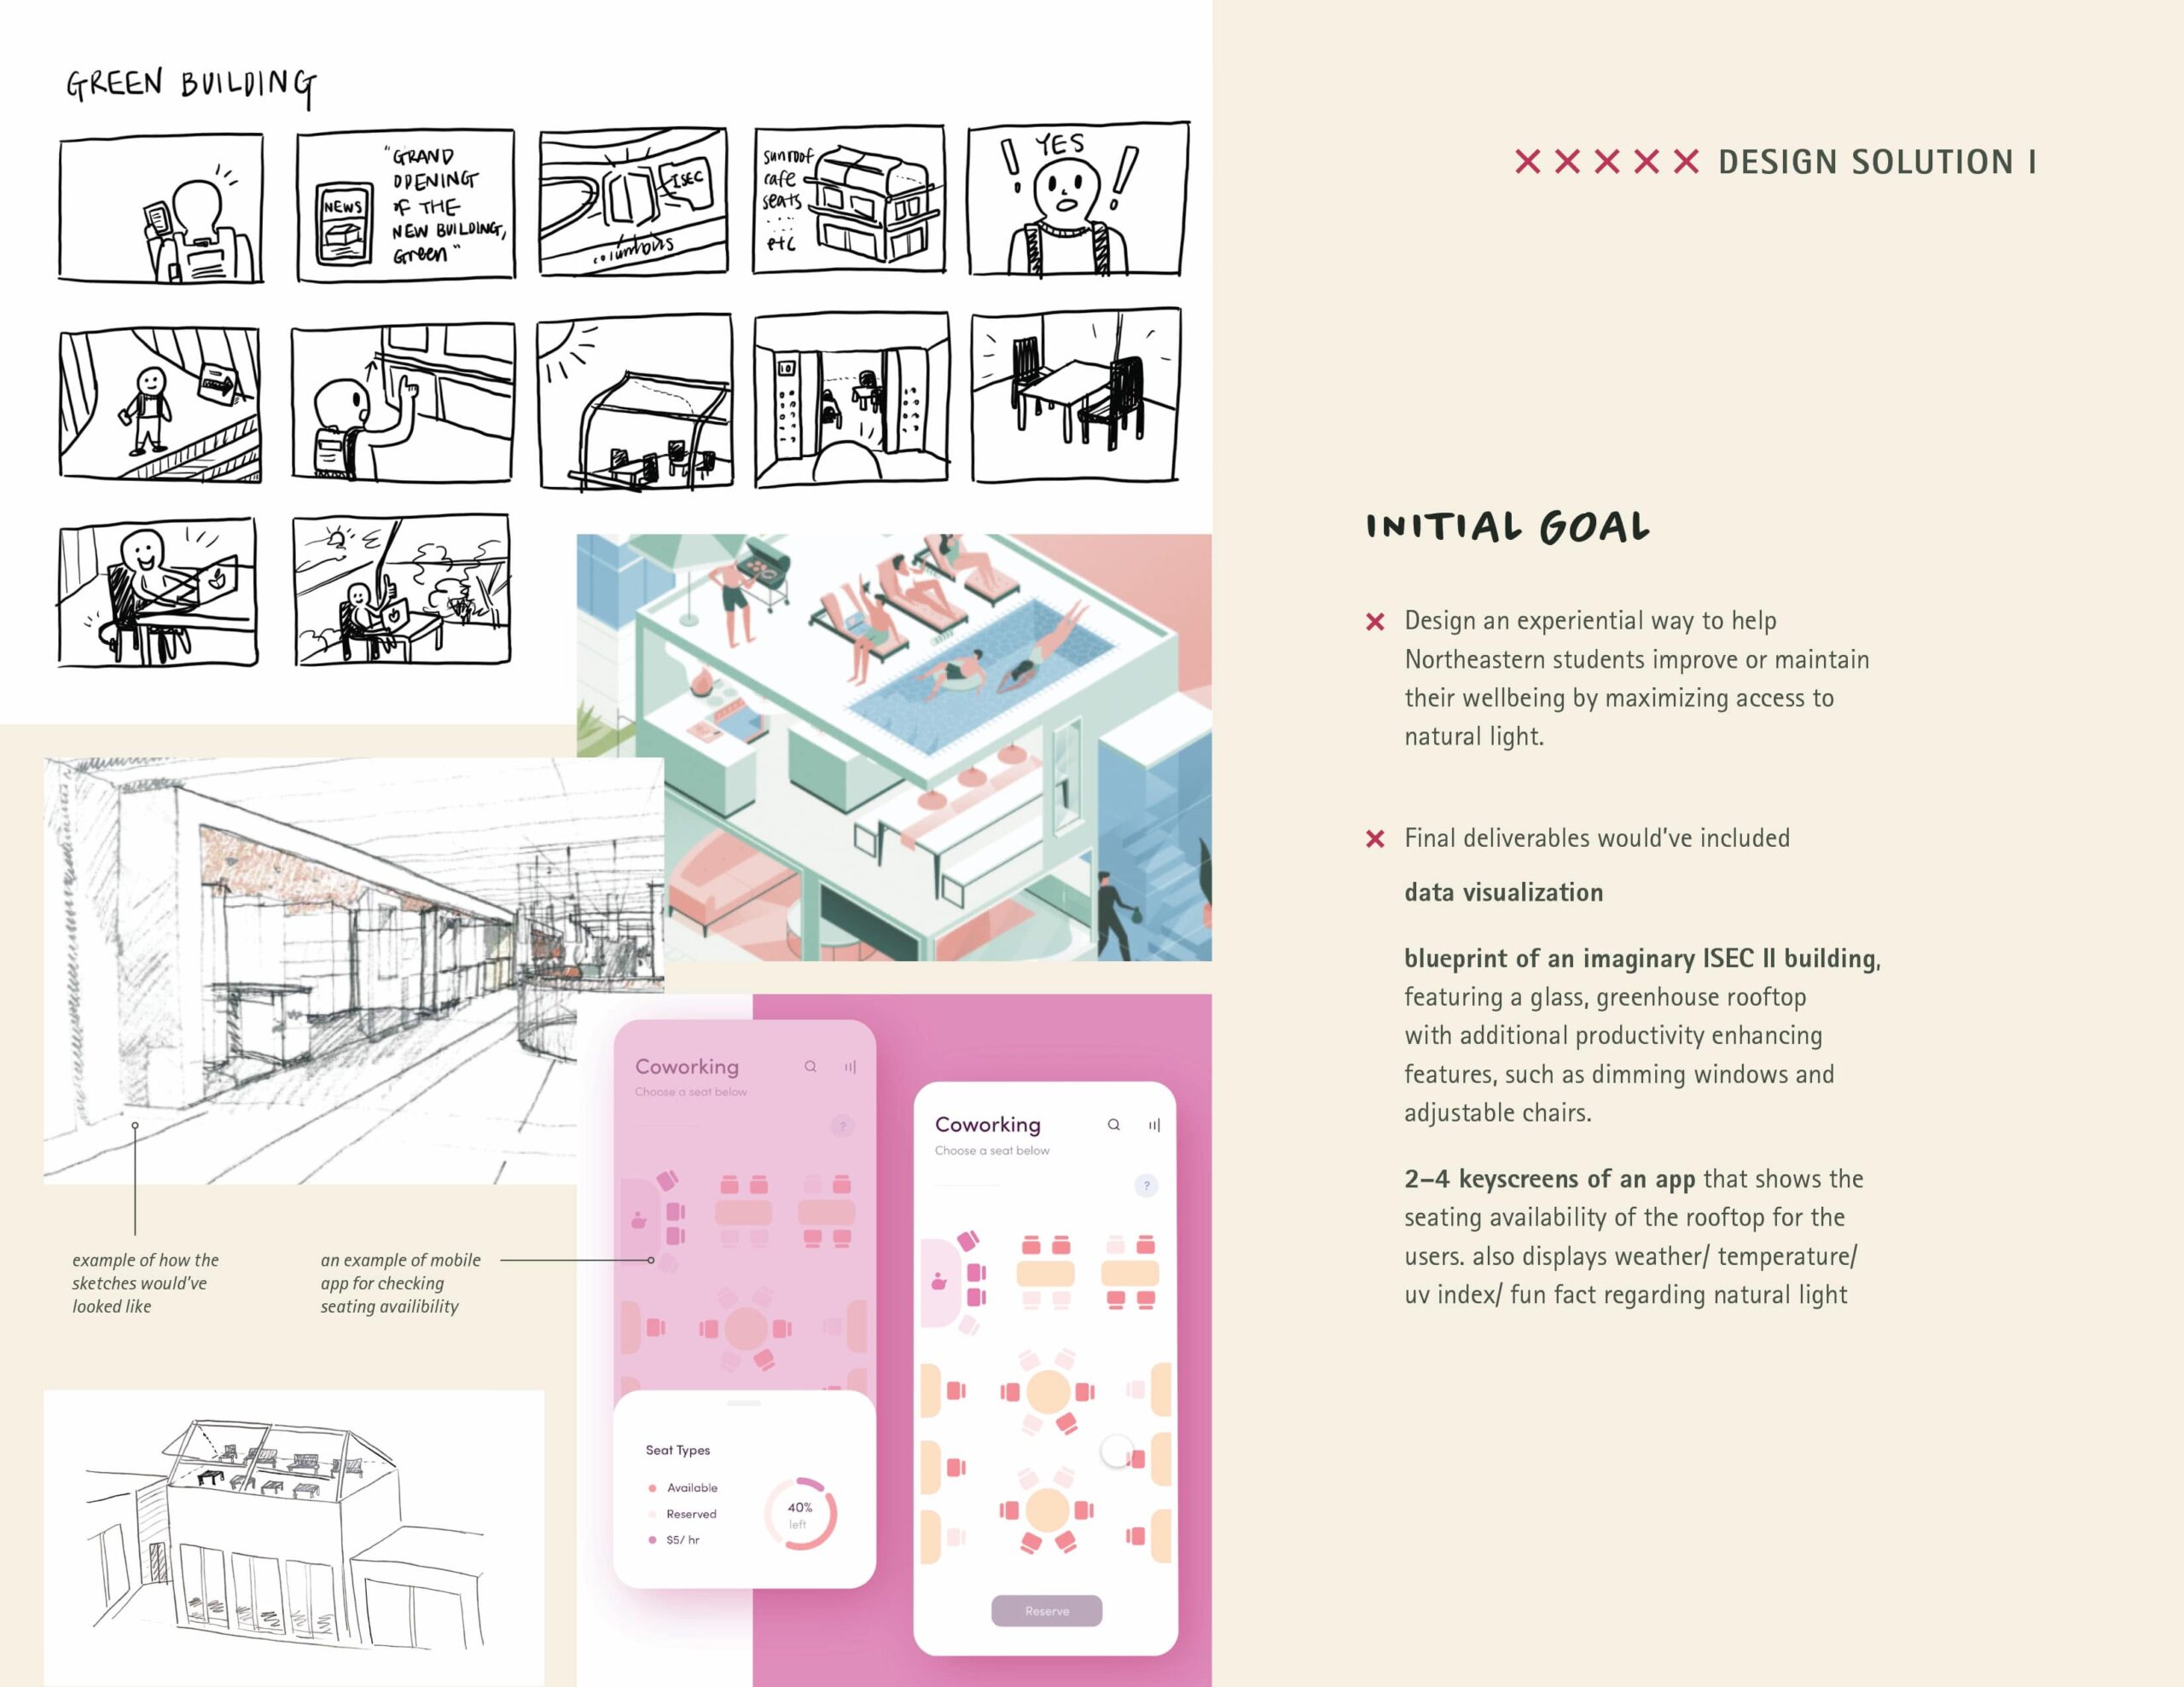
Final Solution
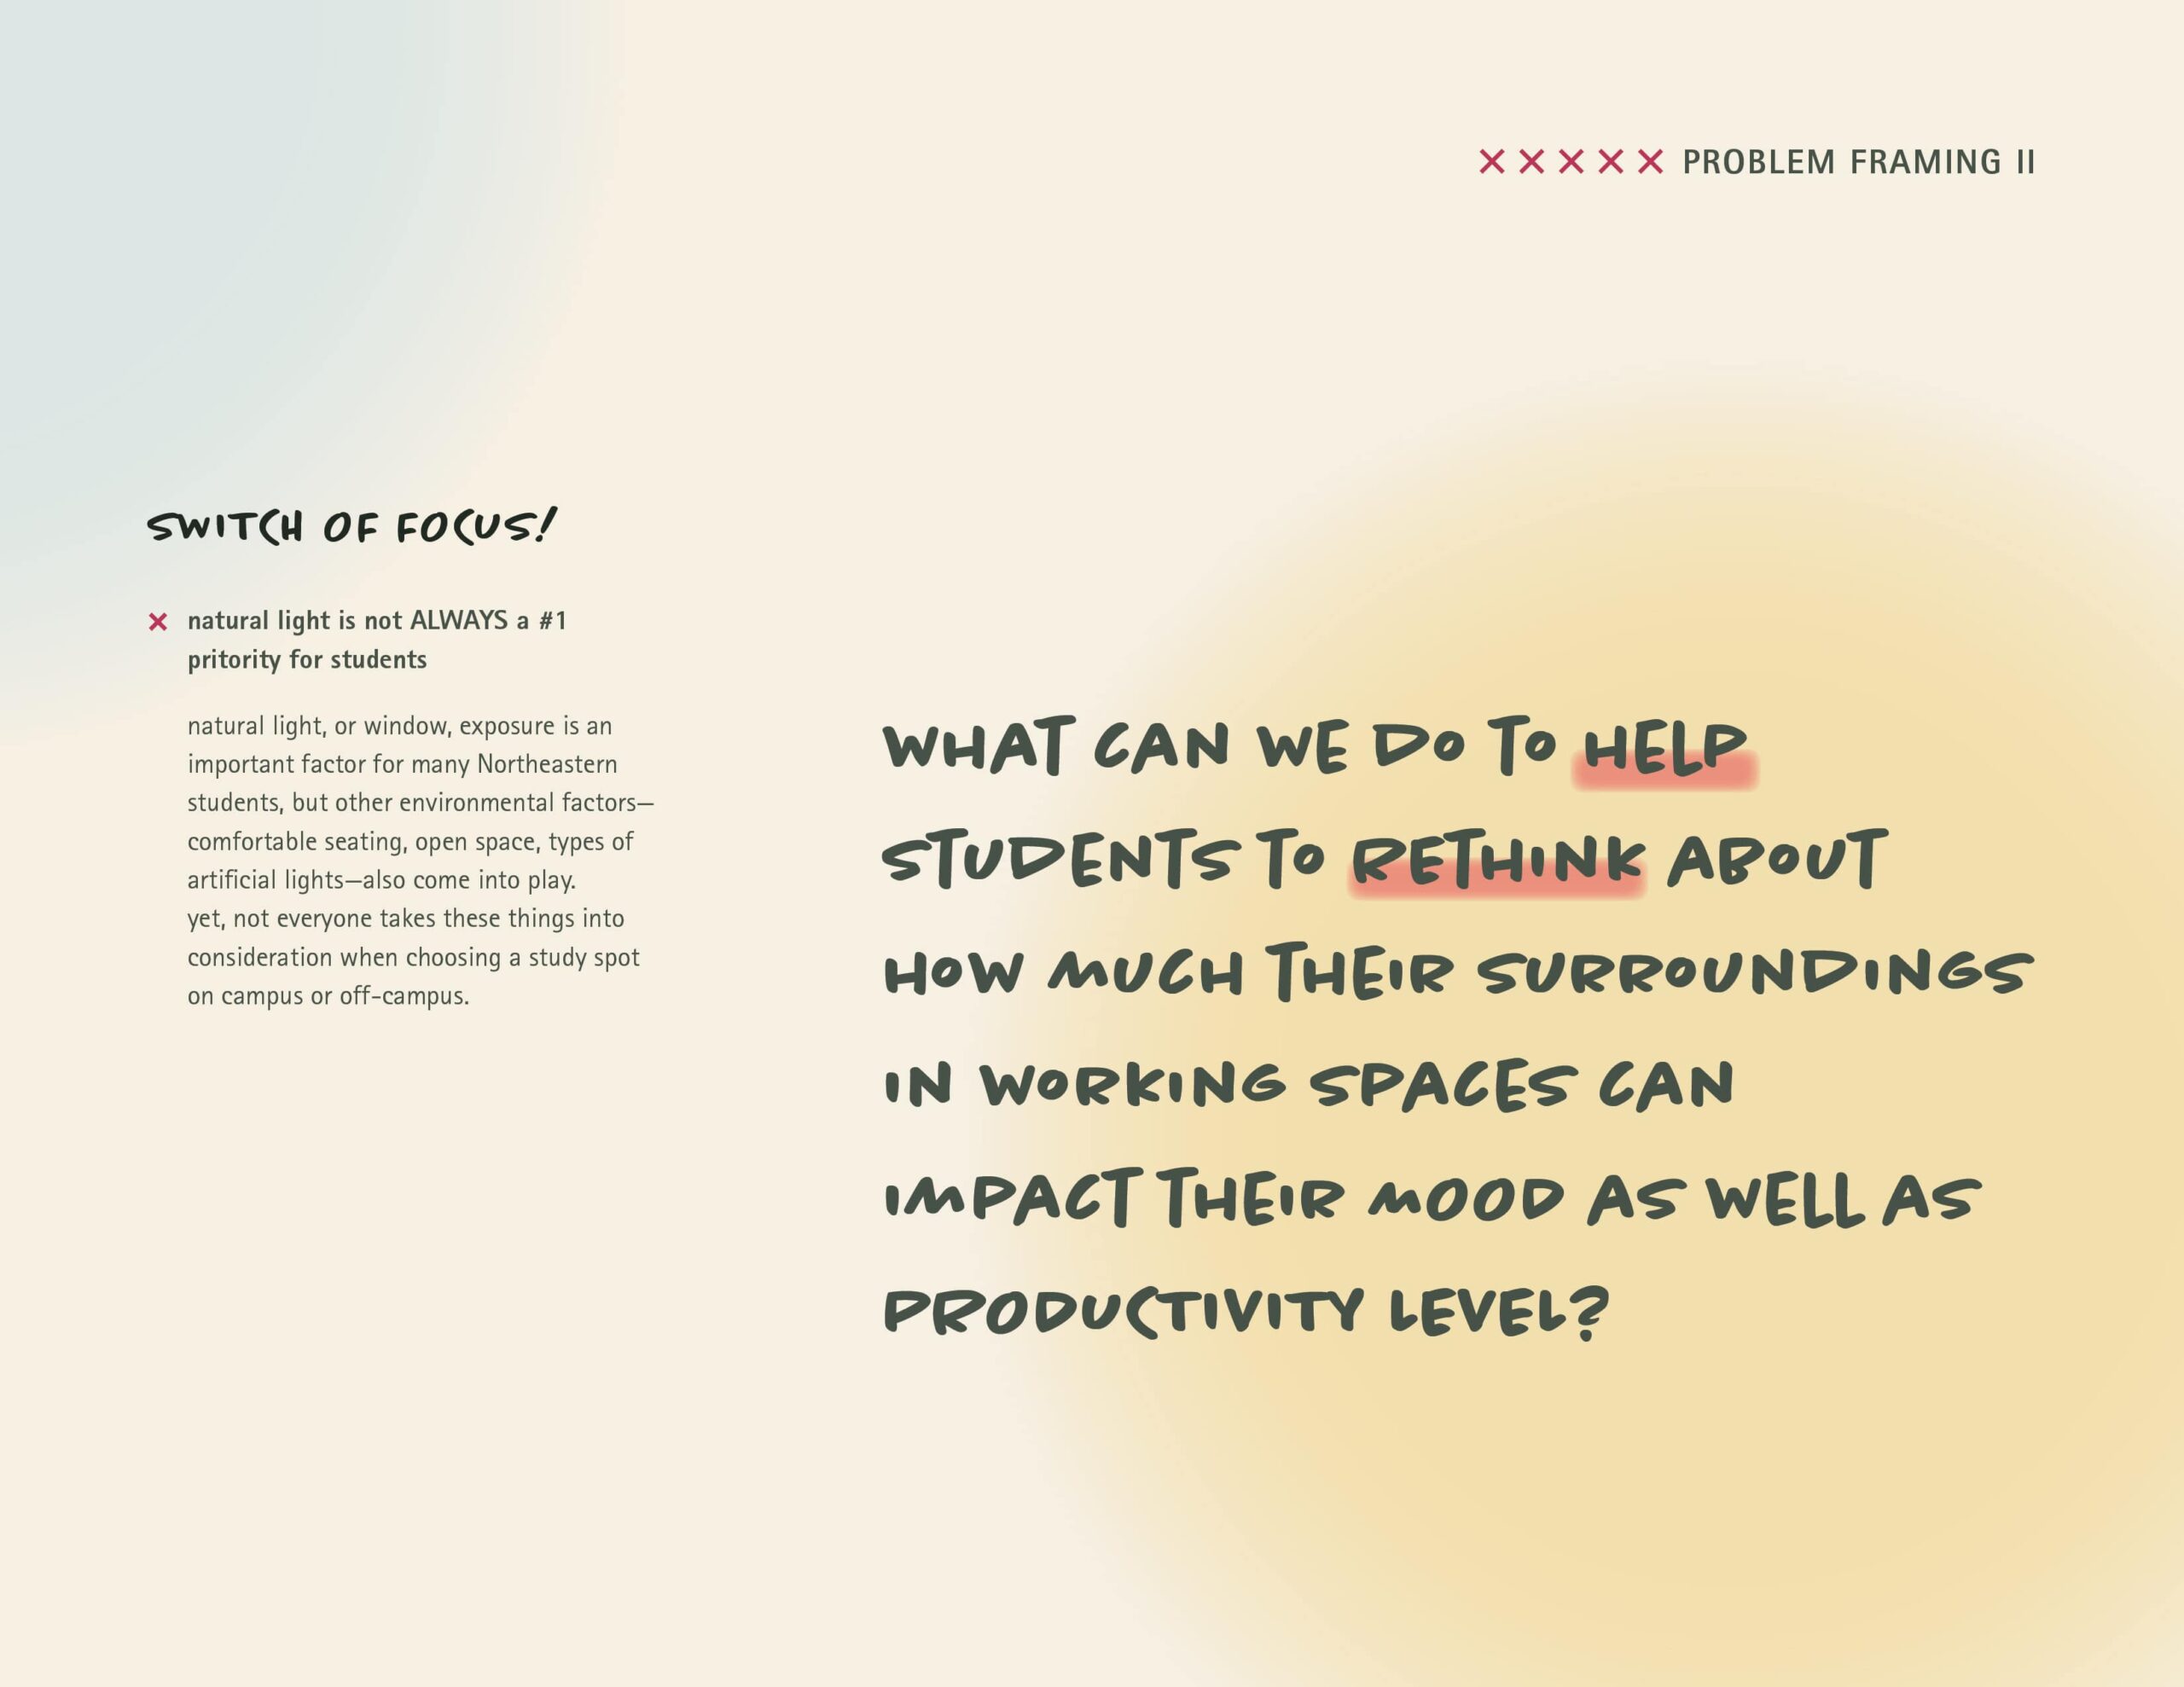
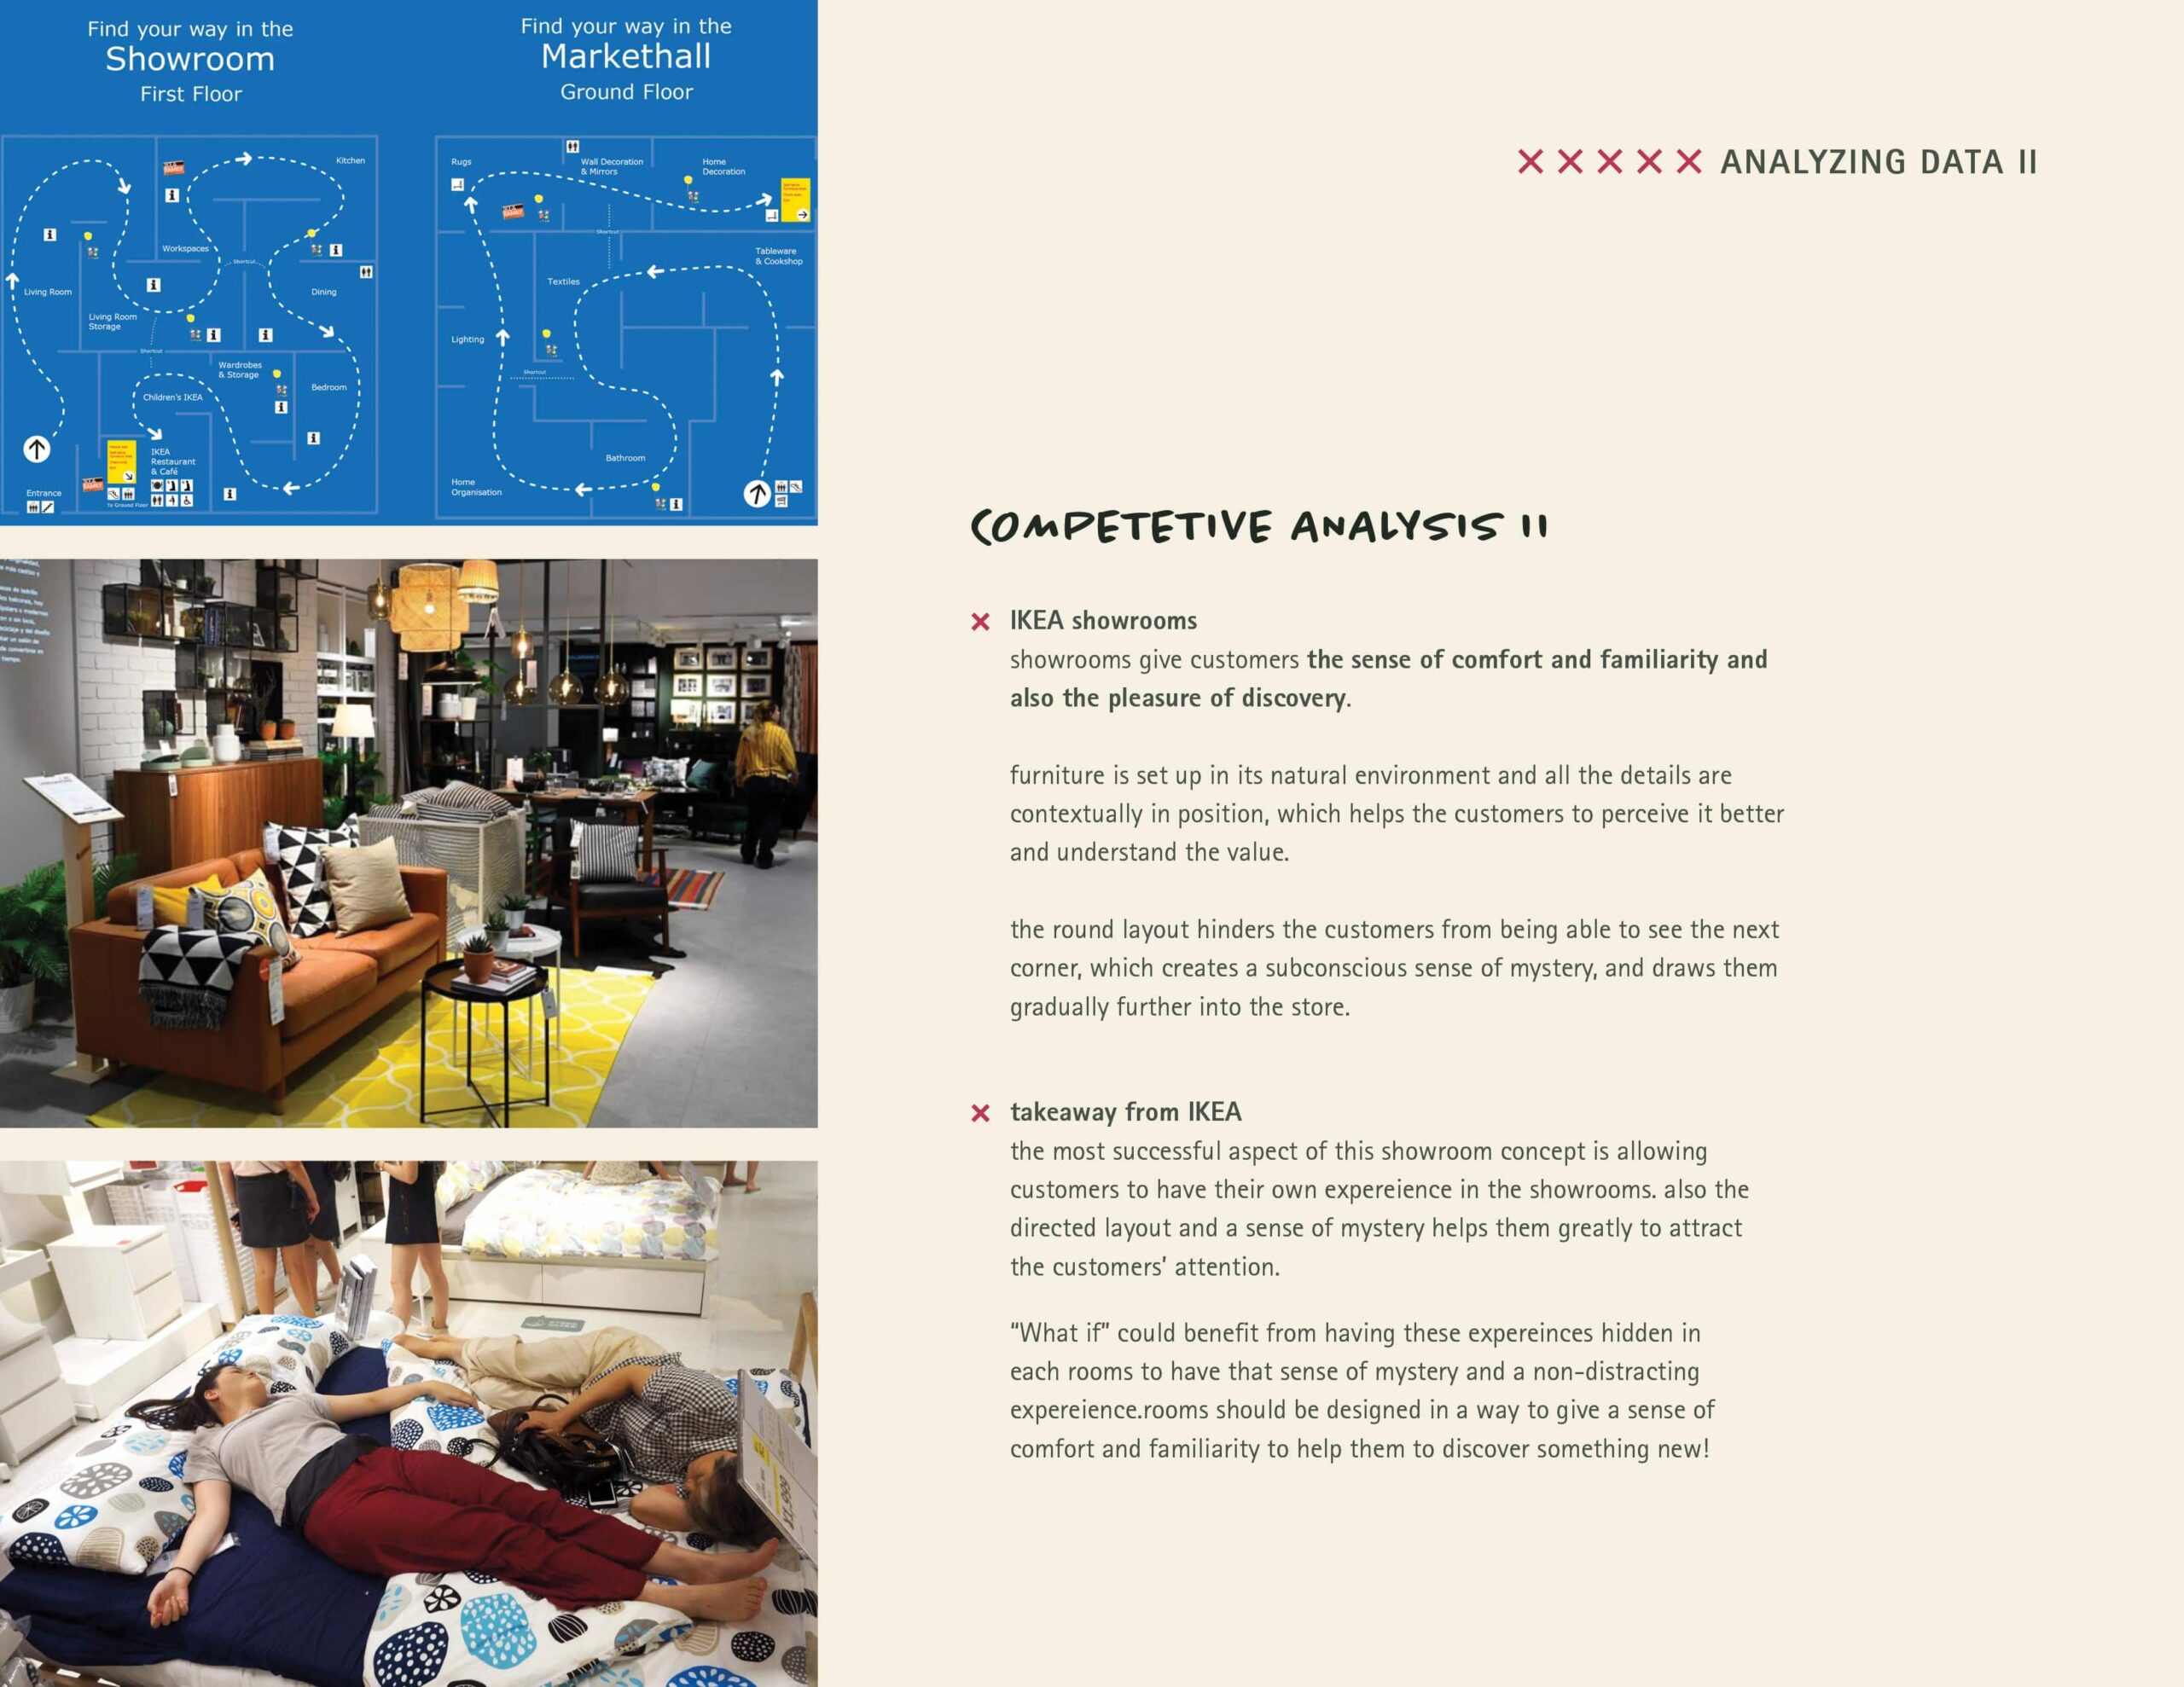
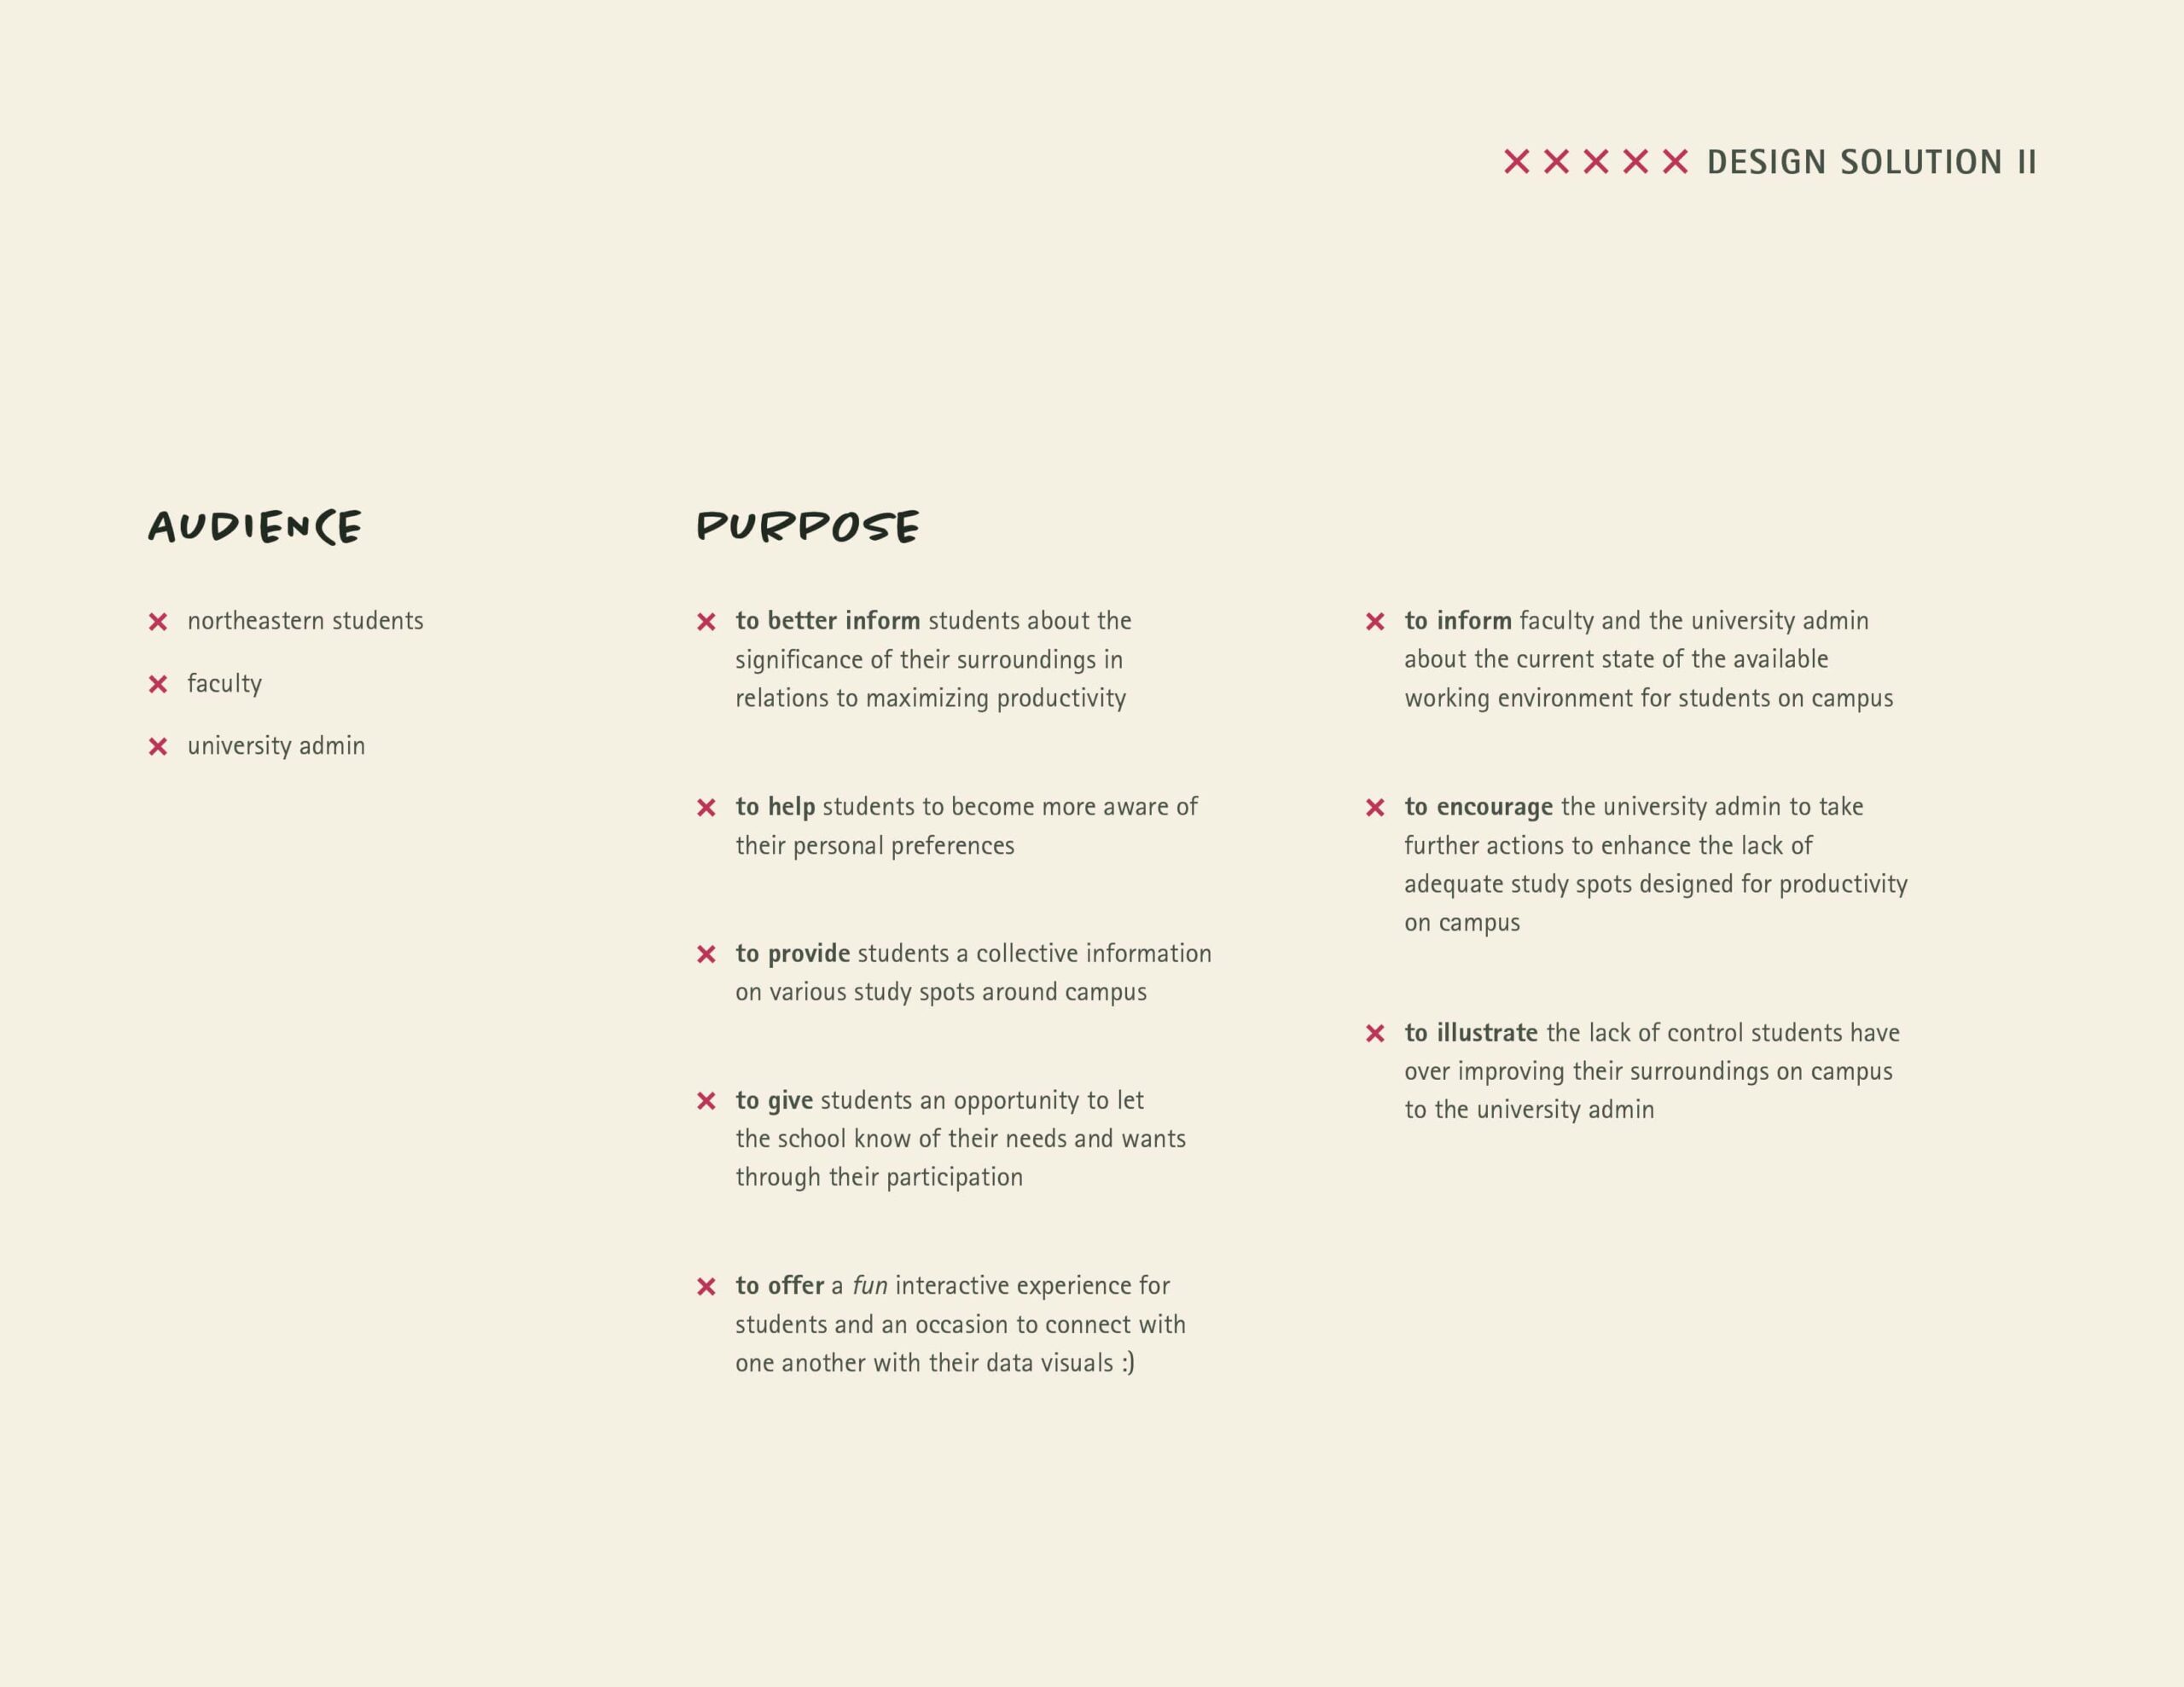
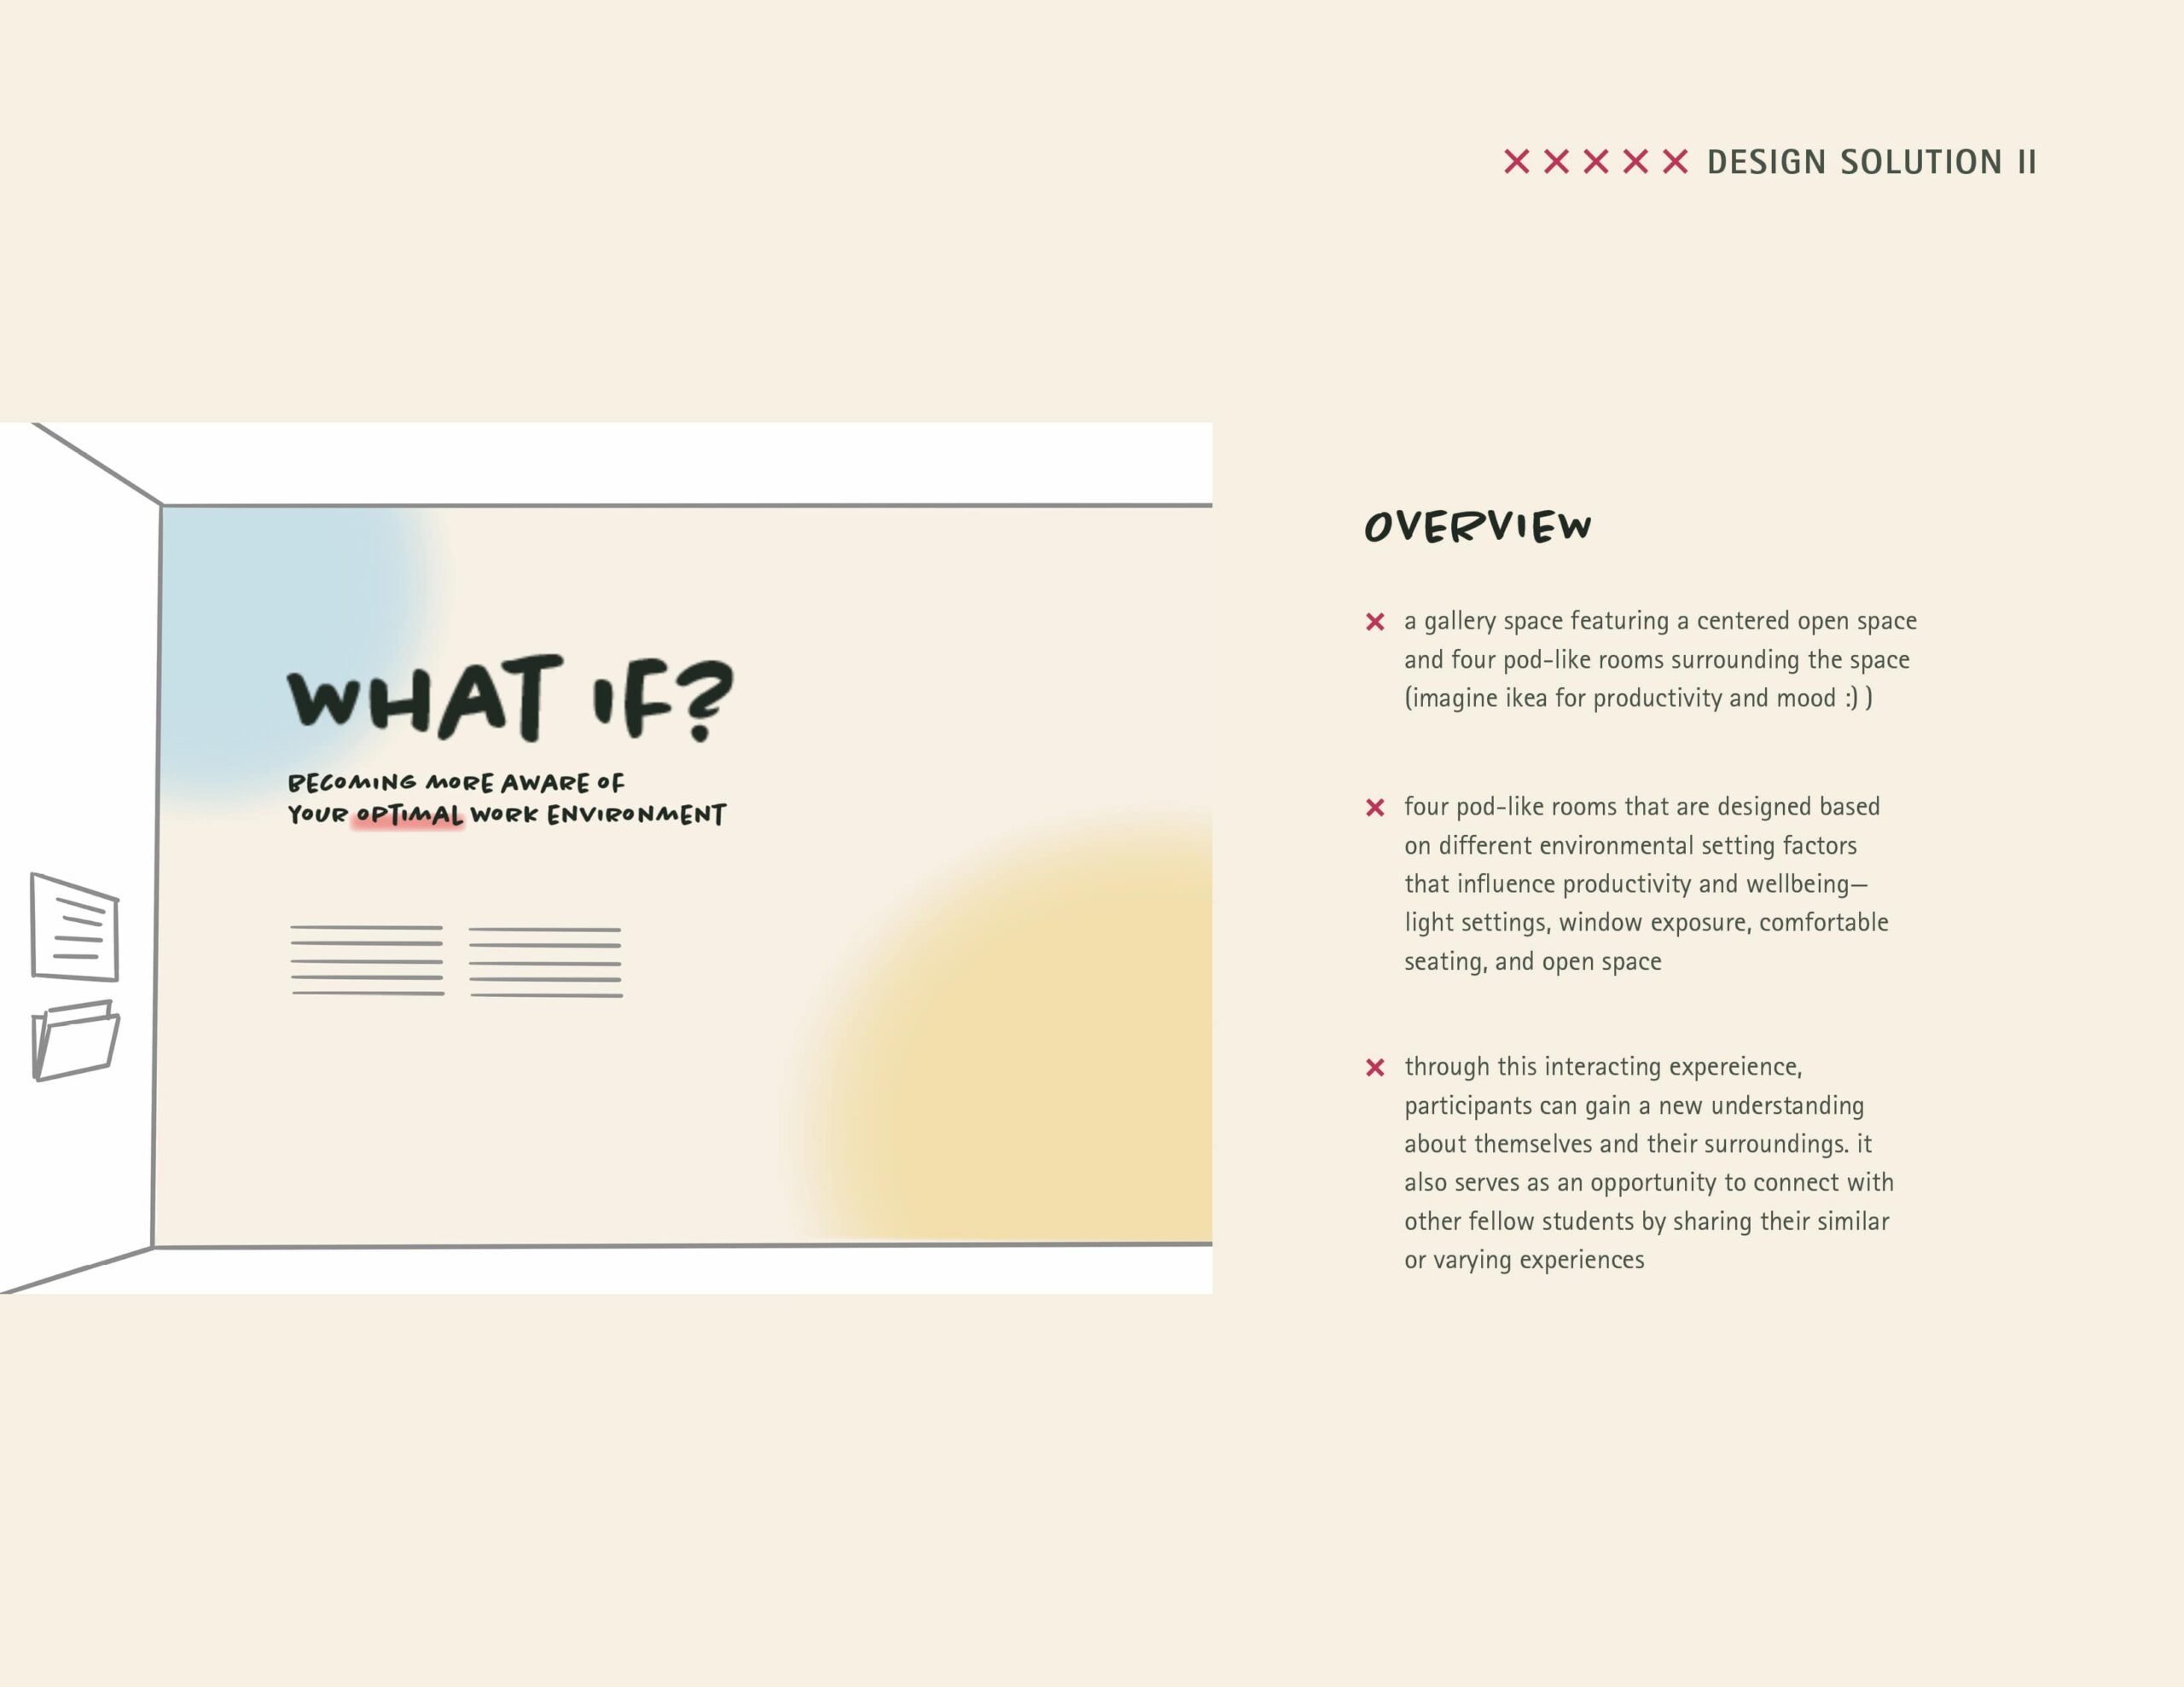
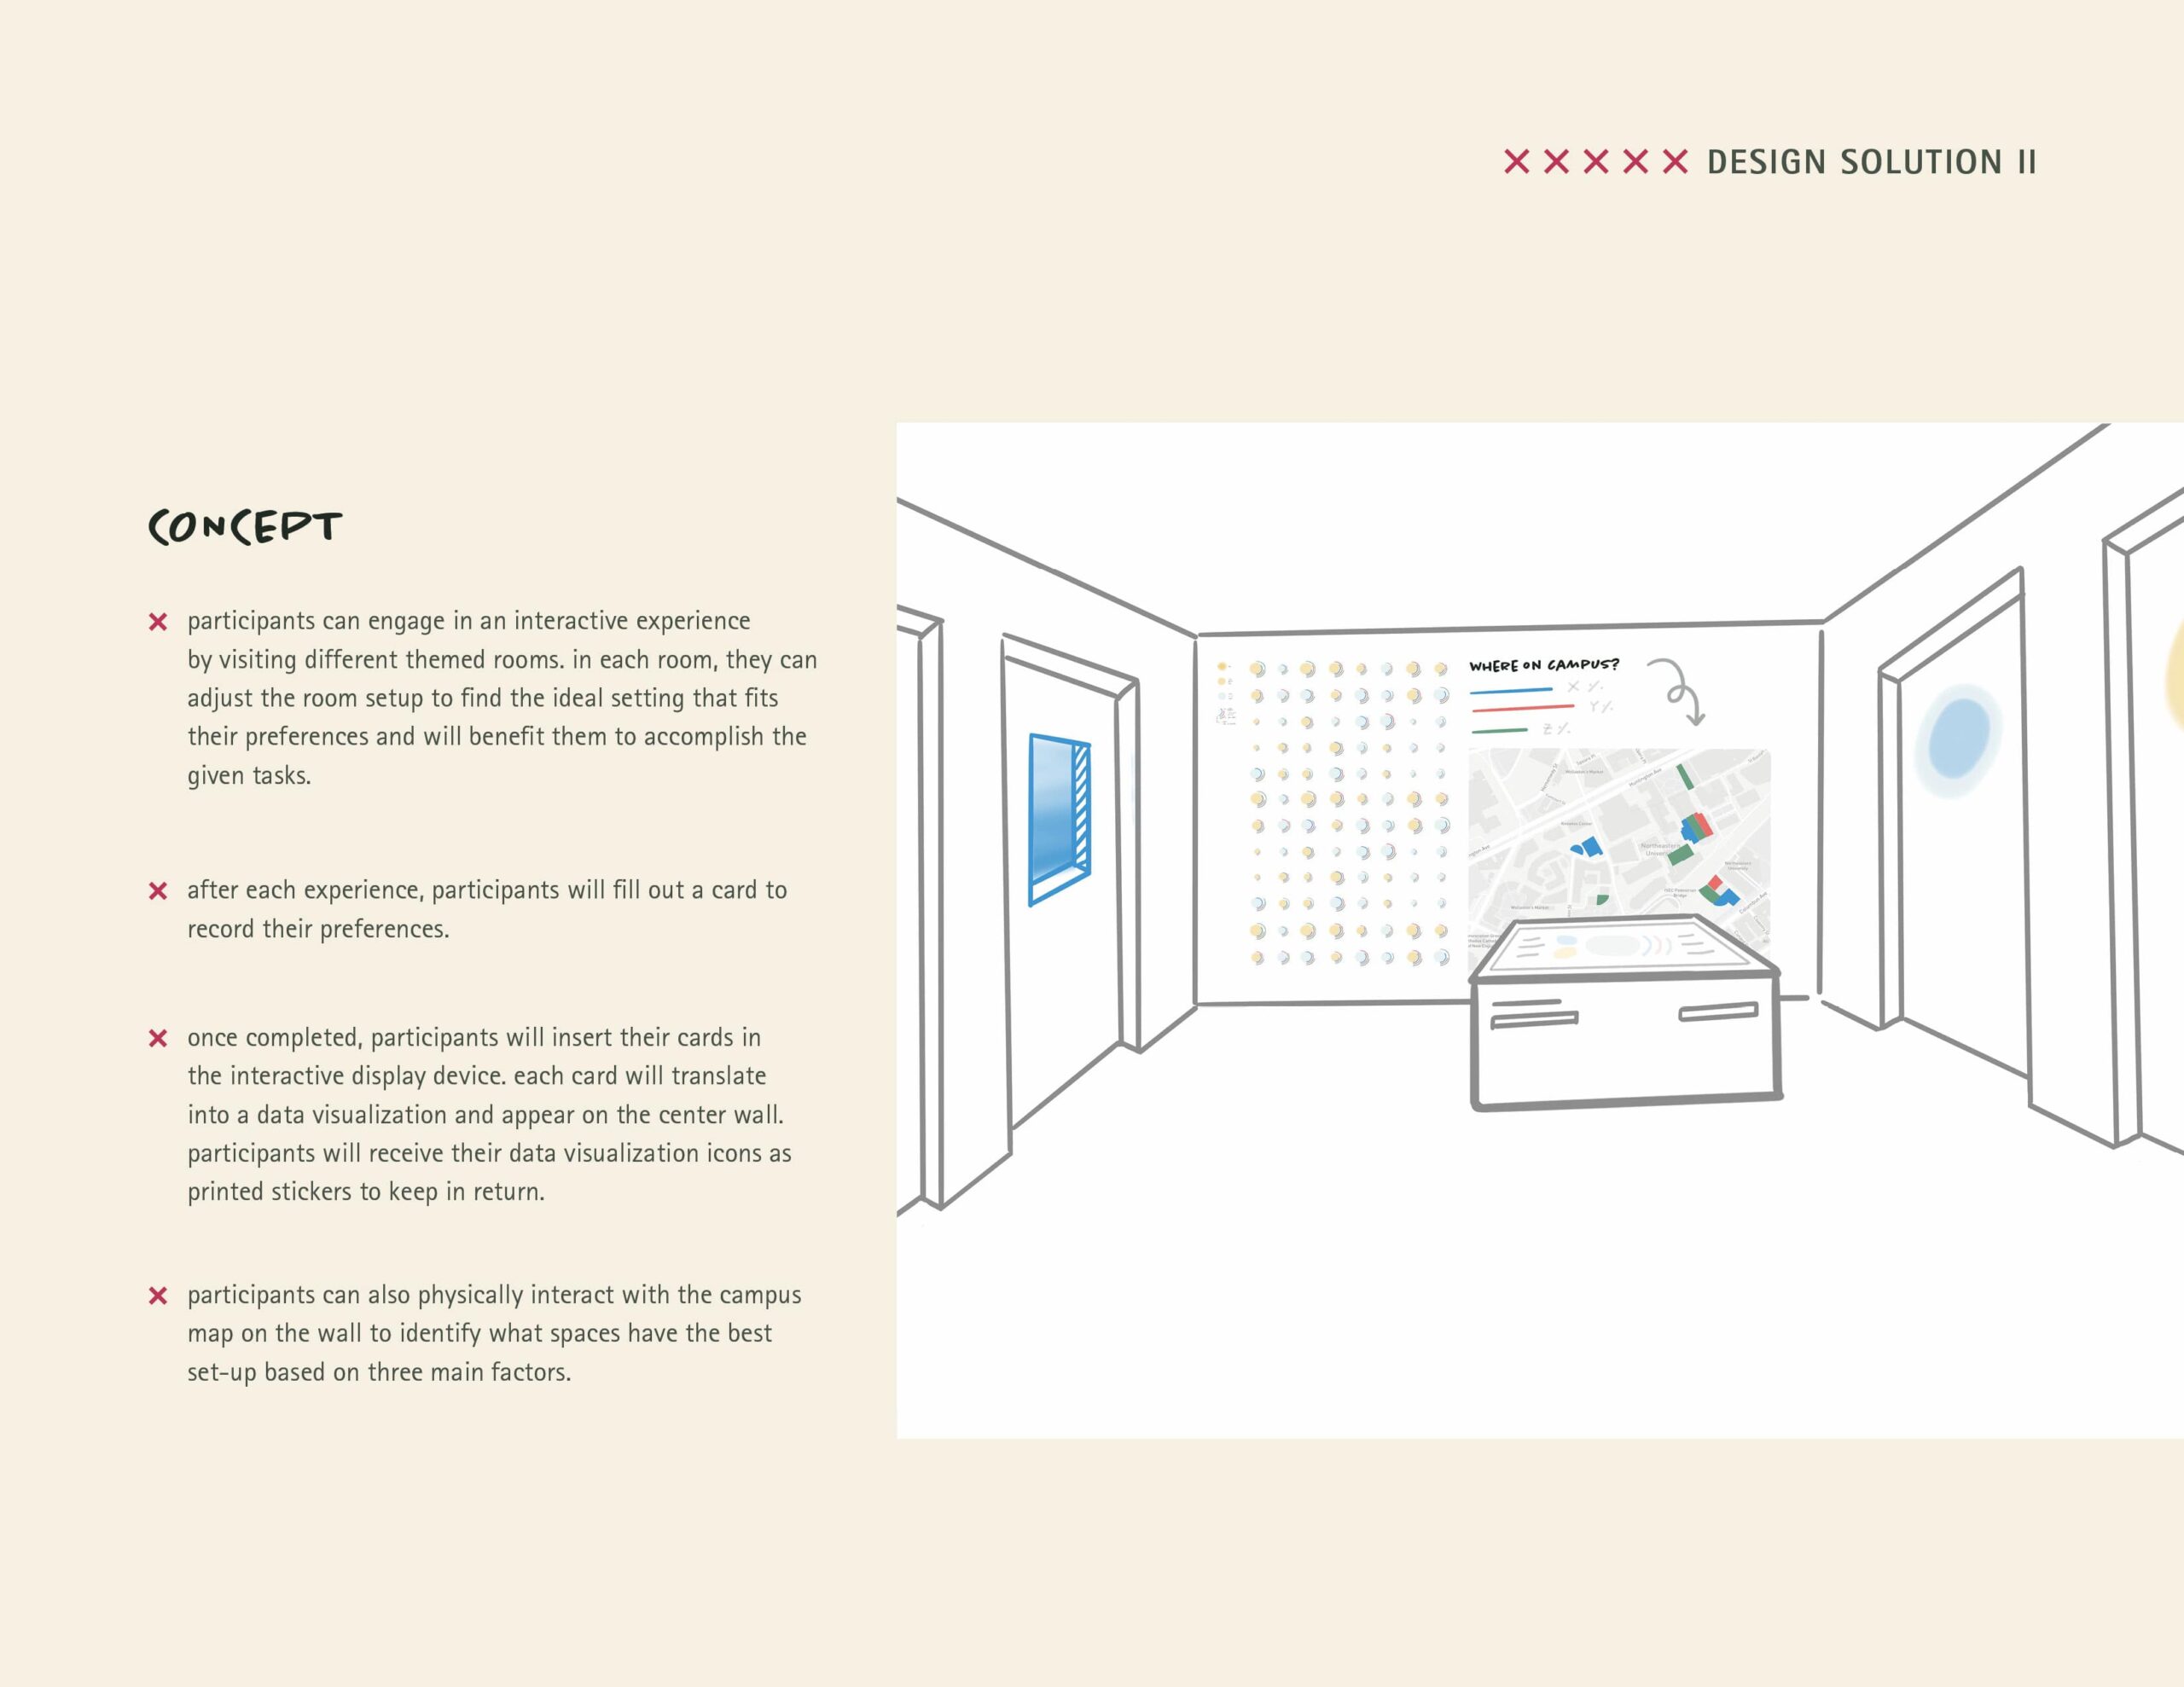
For the final solution, I wanted this data exploration to sit within an informative exhibition design. After synthesizing my user research and competitive analysis findings, I broadened the main topic from "lighting" to "surroundings." Then I conceptualized an interactive exhibition that can help students to prioritize their well-being and productivity.
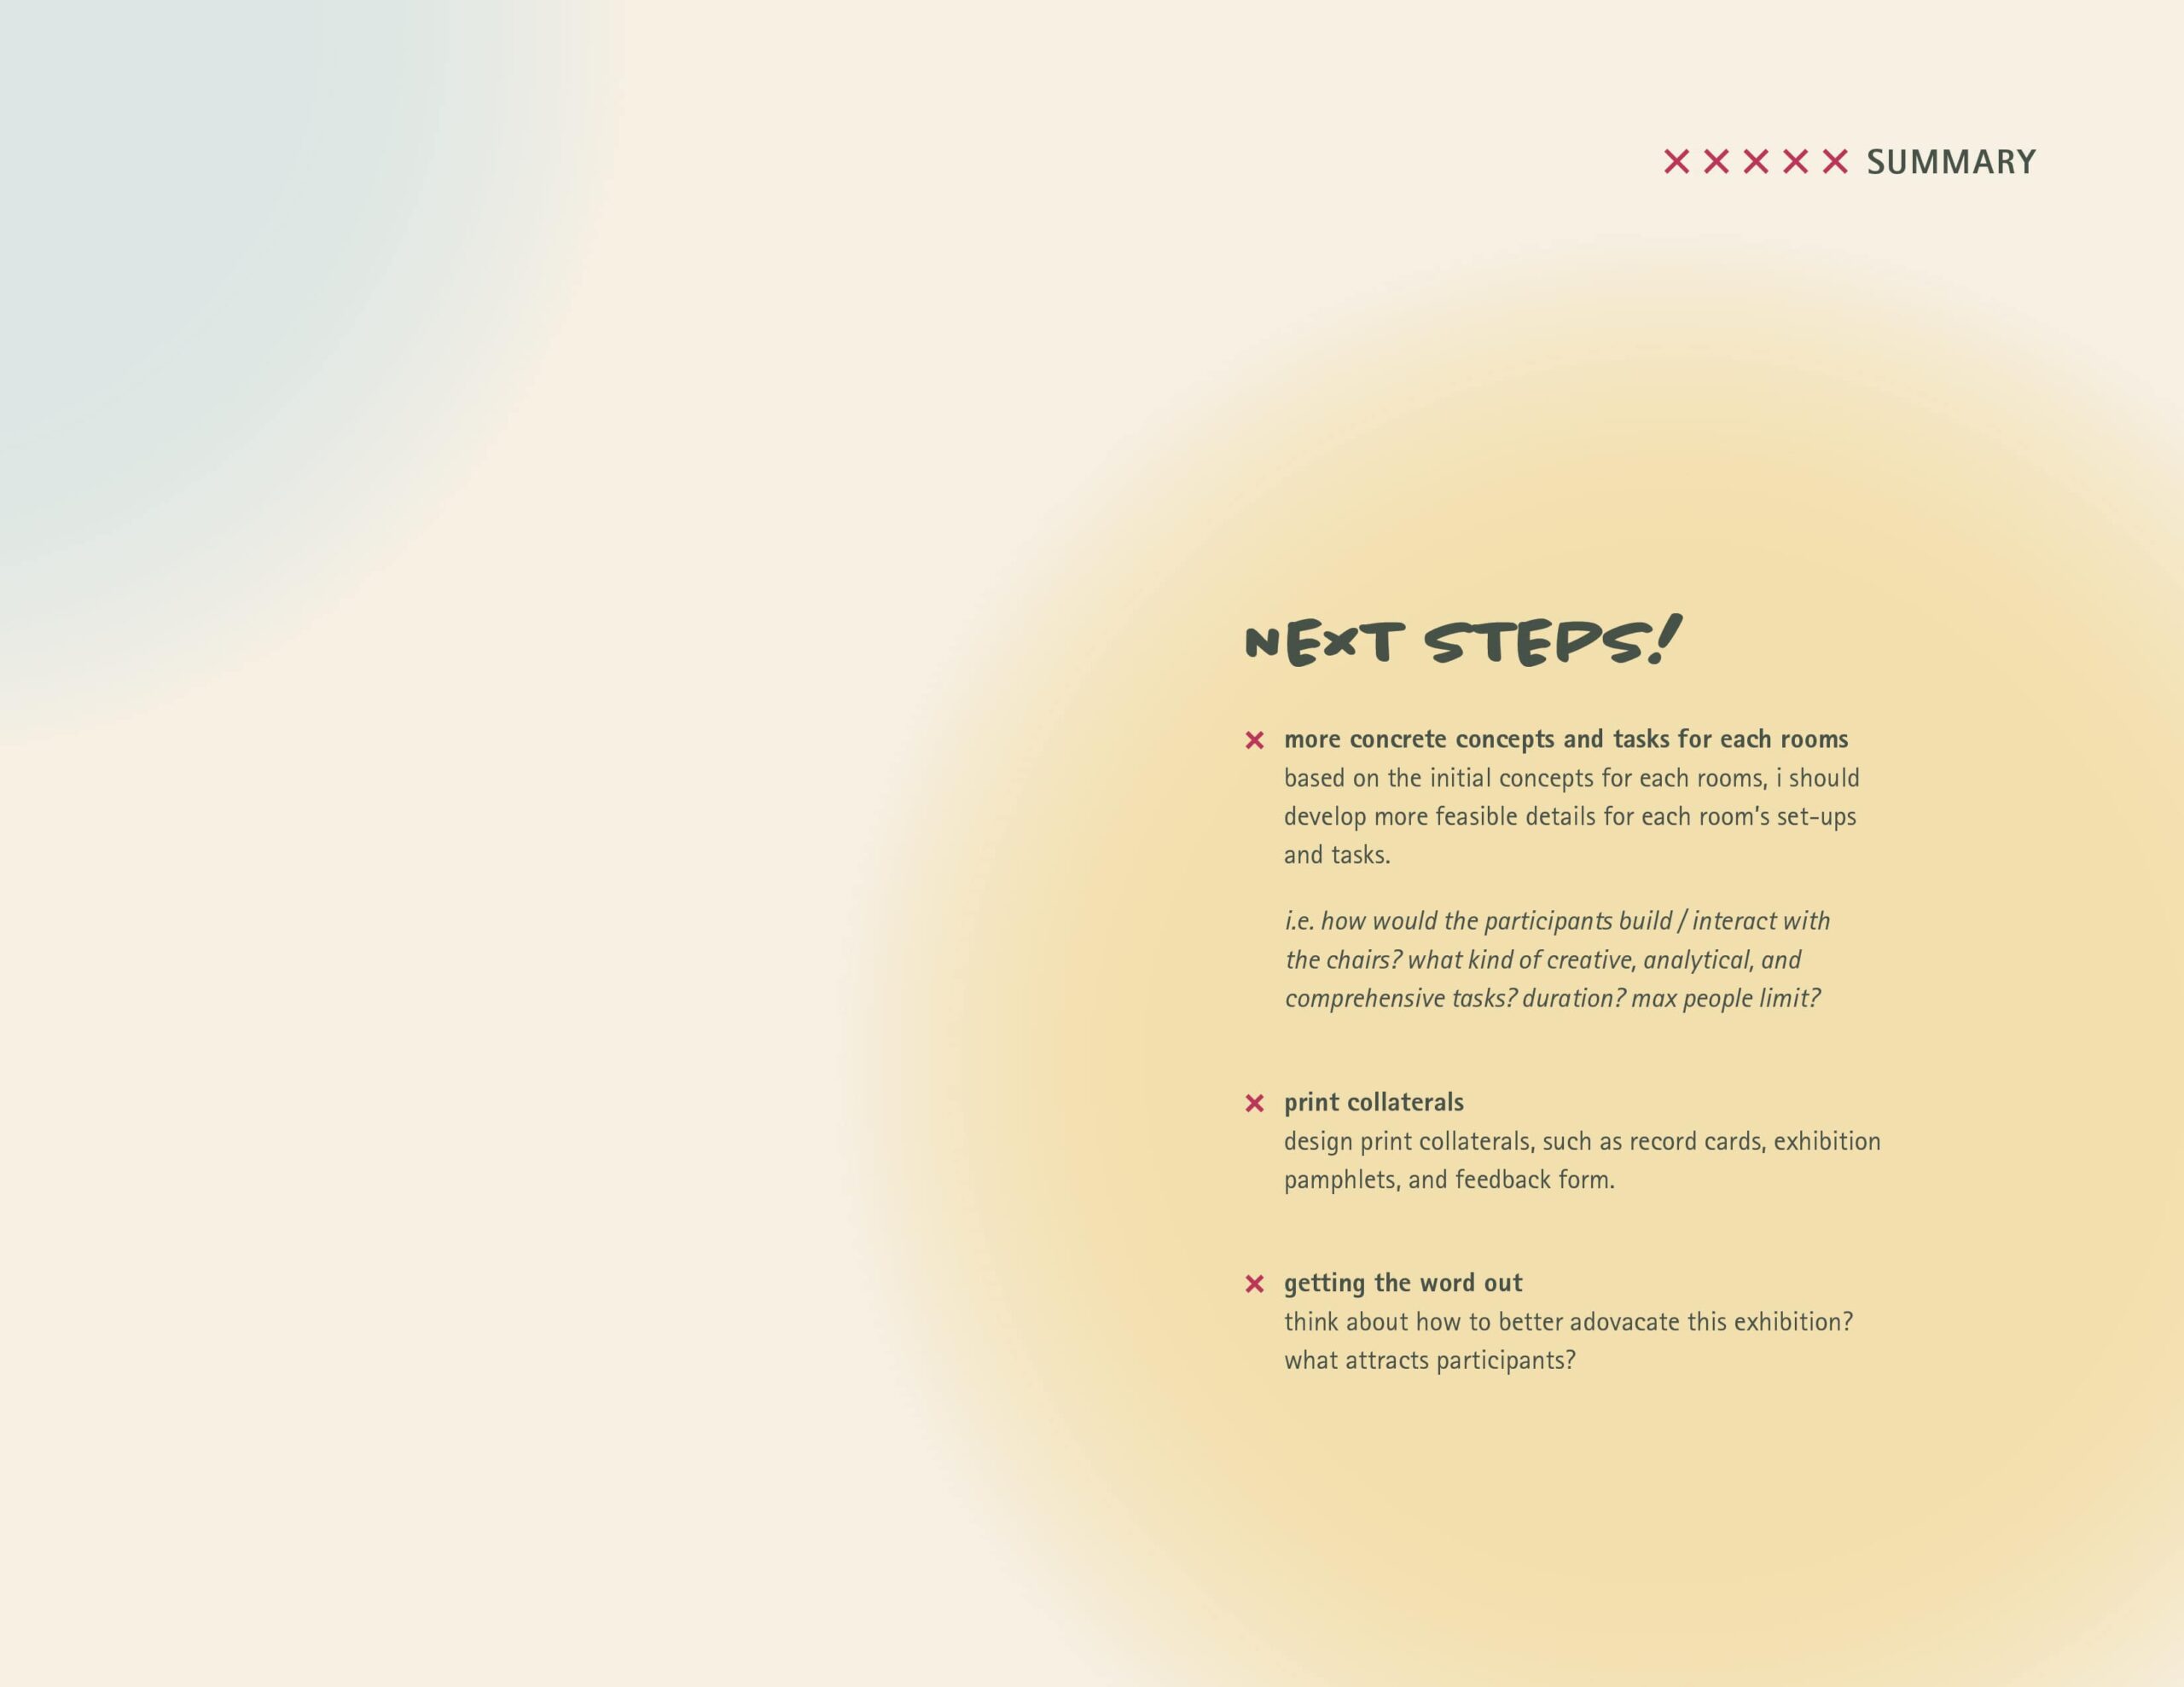
Proposal Deck